“Patterns repeat, because human nature hasn’t changed for thousands of years” said legendary trader Jesse Lauriston Livermore.
We believe that today, Wall Street, broadly speaking, is wrong. Over the last 40 years, trillions have been successfully invested based on exhaustive research around valuations and economic forecasts. Today, with the end of a 40-year tailwind of falling interest rates, the golden age for equity, bond, and real estate returns has ended. After four decades of declining interest rates which, by definition, increase the market value of all income streams, prevailing conventional investment strategy is now fundamentally flawed, skewed, or obsolete. Only through an investment framework that embraces inflation or a commodity cycle, such as that which existed in the 1970s, can investors and Wall Street investment counsel hope to reproduce the high returns of the last 40 years achieved in stocks, bonds, and real estate.
This year end letter will provide models which show that we are entering an inflationary commodity cycle similar to the 1970’s. We will also show cyclical equity overvaluation with models championed by investment giants including Robert Shiller and Warren Buffett.
The Inflationary Commodity Cycle:
The impact of inflation — a long dormant fundamental factor – is crisply delineated in clear cycles in the chart below. This chart of the S&P 500 divided by the Producer Price Index (log), shows market cycles of inflation and deflation rotations since 1887. Today, we are in the early stages of an inflationary cycle that could last a decade if historical cycle durations persist.
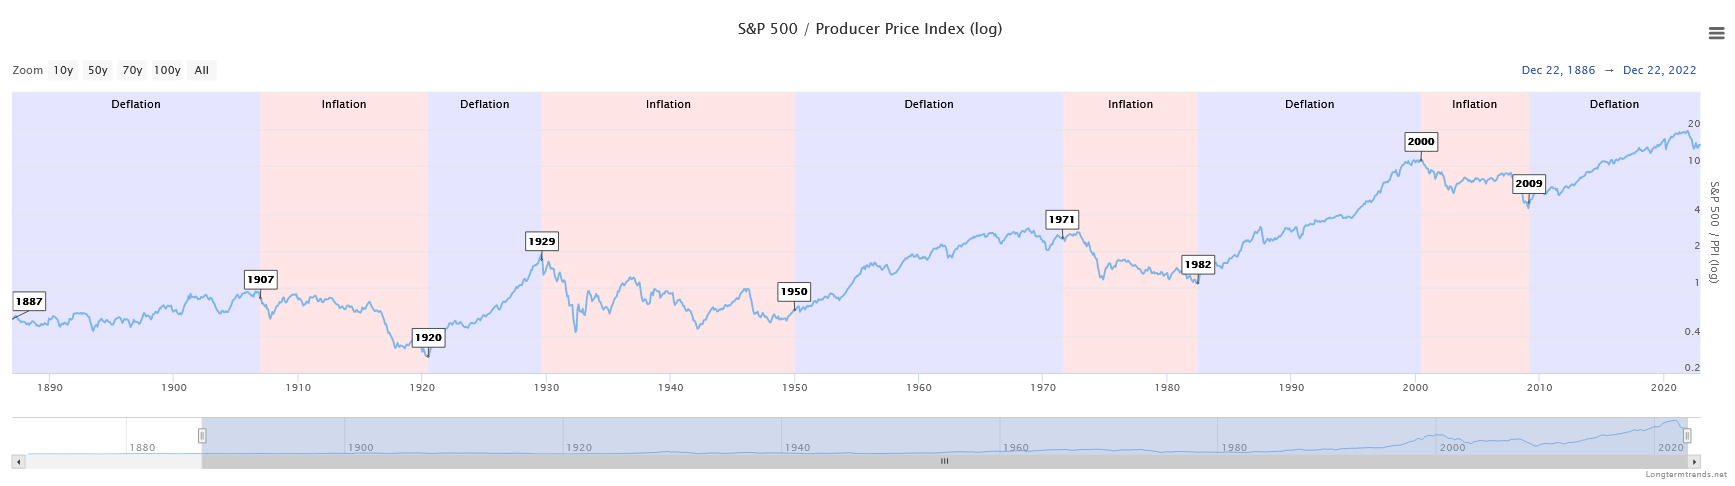
Source: Longtermtrends.net
Another study that shows clearly delineated cycles is displayed by the chart below of the ratio of the Commodity Research Bureau “CRB” index to the S&P 500 index. The chart below shows the ratio bottoming in 1999 and peaking in 2008 when commodities peaked. From 1999 to 2008, oil prices rose from $20/bbl to $174/bbl. During the deflationary cycle from 2009 to 2020, the S&P 500 outperformed commodities until oil crashed during the COVID 2020 collapse. This CBR/S&P 500 ratio suggests that over the course of this cycle, commodities and its proxies could outperform the S&P 500 on the order of 700% to 900%.
Oil bottomed in March and May of 2020 and commodities broadly rose sharply in 2022. This commodity inflation, combined with the Federal Reserve’s ill-conceived and relaxed inflation posture announced at the Jackson Hole conference in 2020, initiated the inflationary cycle we envision persisting through this decade.
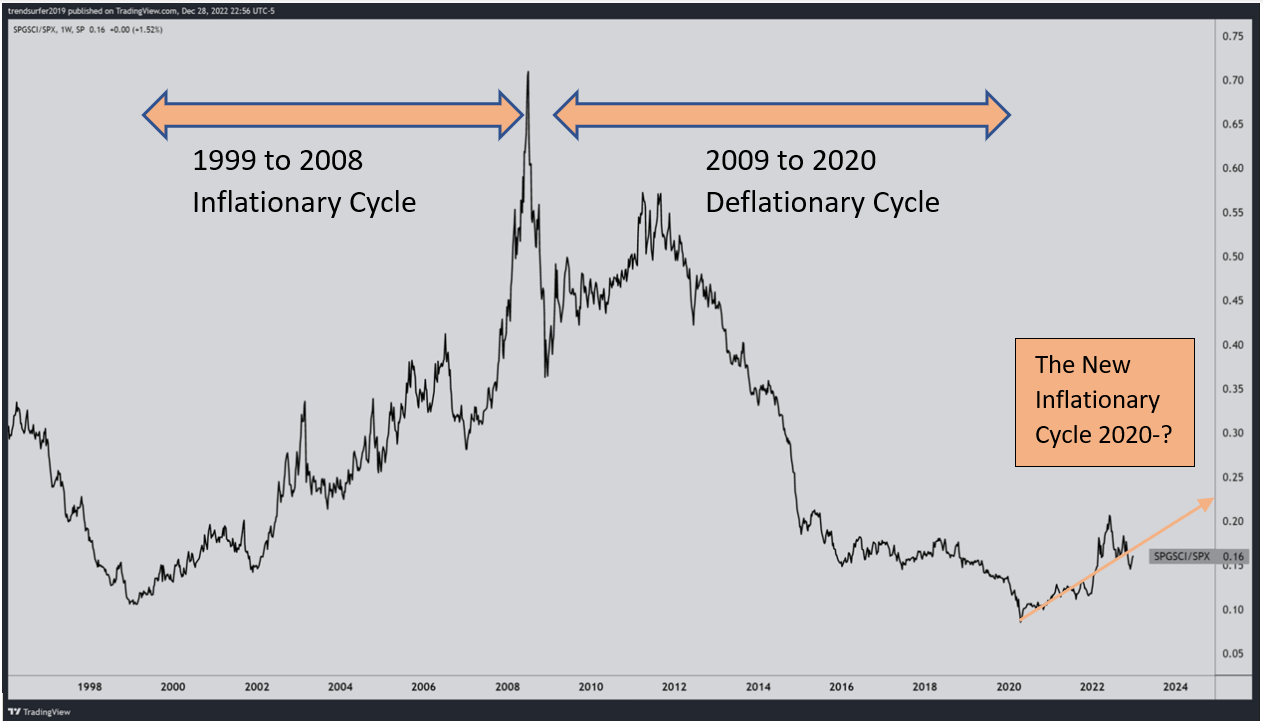
Source: TradingView and IGA Research
Our investment thesis is that pragmatic inflation oriented investing will outperform traditional S&P 500 targeted strategies. Furthermore, today’s overpriced stock and bond markets will make conventional 60% equity 40% bond portfolios a disappointing investment strategy for years. By investing in value stocks, emerging markets, commodities, precious metals, energy, and small capitalization stocks, we believe investors will generate attractive non-correlated returns.
A good example of the potential outperformance from our inflation/deflation strategy is shown by comparing the performance of the Energy Select Sector SPDR Fund (XLE) to the Invesco QQQ Trust (QQQ). Energy is an excellent proxy for inflation and the NASDAQ 100 index of the 100 largest non-financial large capitalization growth stocks is an excellent proxy for deflation.
- From 1999 to 2008 the outperformance of the XLE, which annualized 22%, compared to the QQQ, which annualized a -3.16%, led to outperformance or alpha of 25.16% per year. This is extraordinary.
- From 2009 to 2022, when deflation and Central Bank accommodation defined the investment climate, the QQQ annualized 20% and the XLE annualized 3.6%. This outperformance or alpha of 16.4% over 13 years is also extraordinary.
The exceptional outperformance for these periods illustrates how challenging recency bias can be for investors. Investors who find a methodology which yields attractive returns year after year will inevitably believe that those trends, sectors, or strategies will persist. This leads to new era thinking and causes parabolic price action. These behaviors, in turn, create manias and bubbles. These bubbles repeat throughout history and often precede periods of inflation. The stock market peaked in 1907, 1929, 1971, 2000, and 2021. (See the first chart of inflationary and deflationary cycles.)
The chart below shows the performance of both XLE and QQQ since April 1999 to the present. We showed the inflation cycle and the deflation cycle and respective ETF performances, during that period.
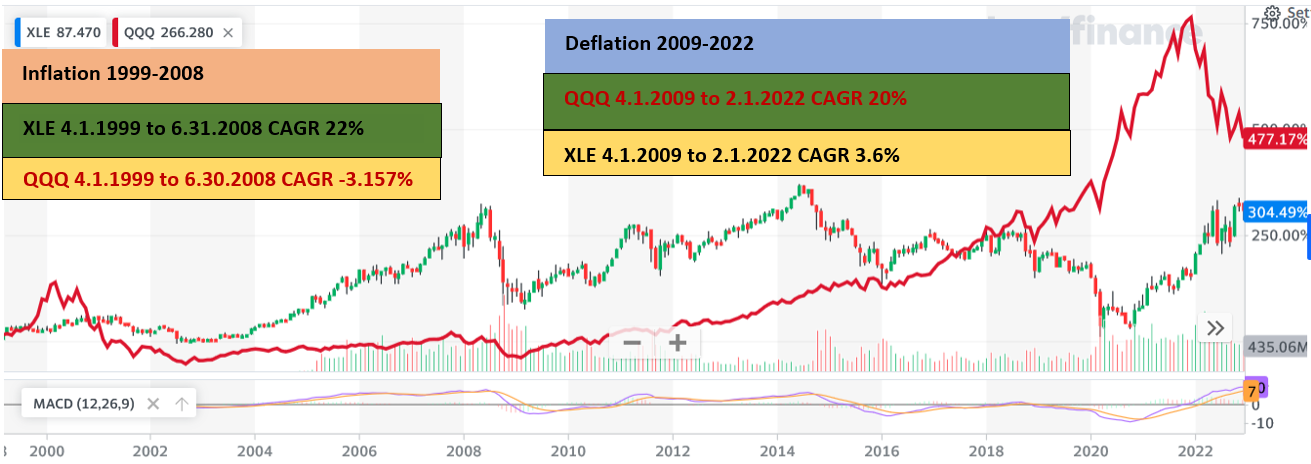
Source: Yahoo.finance.com and IGA Research
These performance differentials suggest that sector allocation can be far more important than traditional stock bond asset allocation decisions.
Bubble Equity Market Valuations:
Nobel Laureate, Robert Shiller created the Cyclically Adjusted Price Earnings “CAPE” ratio which shows a ten year price earnings multiple for the S&P 500. Shiller’s CAPE ratio successfully identified historic market peaks in 1901, 1929, 1966, 2000, and 2021. Investors should conclude from the CAPE ratio chart below, that a multiyear period of underperformance for S&P 500 investors is probable.
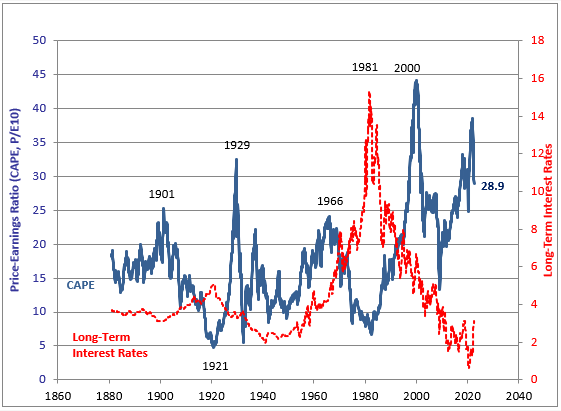
Source: Yale.edu
Similarly, Warren Buffett’s so called “favorite indicator” compares the valuation of the Willshire 5000 index to the US GDP. By dividing market cap of the broad based Wilshire 5000 index [currently $41.0 trillion] by the gross domestic product “GDP” [currently $26 trillion on an annualized basis], the ratio today shows an historic bubble equity valuation peak. Today’s bubble ratio mirrors that of the late 1960s and the 2000 Tech Bubble. The Buffett Indicator shows the US equity market ratio is 158% and 23% (0.8 standard deviations) above its trend. We believe that traditional equity investment returns will underperform for nearly a decade like it did in the 1970s and during the 1999 to 2009 post bubble equity valuation reversion.
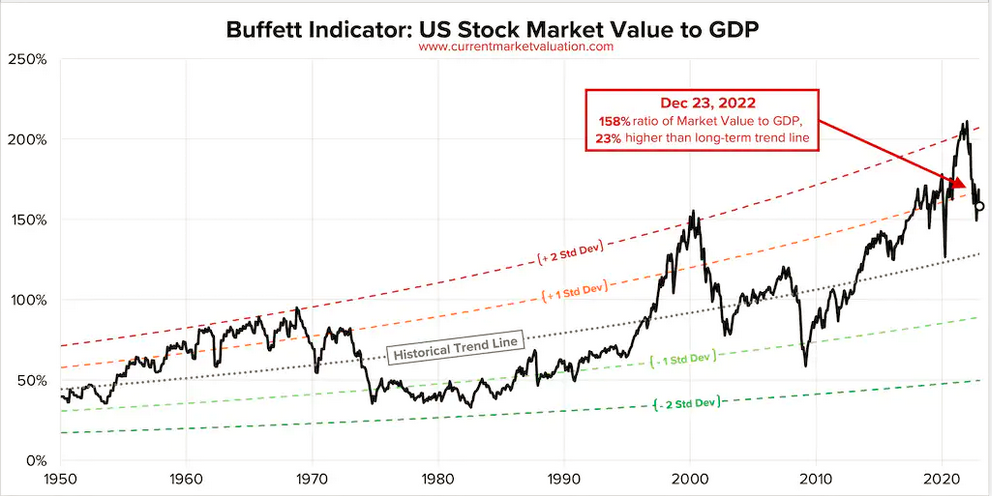
Source: currentmarketvaluations.com
Our 2023 forecast for the S&P 500 is a decline to $3000 based on earnings declining to $200 for the S&P 500 trading at 15 times trailing earnings multiple. 15 times trailing S&P 500 earnings is the average historic trailing multiple the S&P 500 traded at during periods when the CPI has exceeded 3%, according to Sartori’s Dan Niles. From the 2022 year end S&P 500 close of $3839, a decline of 21.8% in the S&P 500 is probable in 2023. Furthermore, from the S&P 500 cycle peak of $4766, a 37% peak to trough decline in the index would be normal for an average recession.
Growth Will Underperform:
A classic problem with every business cycle is that investors tend to extrapolate the recent success of top performing industries and asset classes driving further momentum and exuberance. Following extraordinary performance, the recent sharp declines in the FAANG stocks, the NASDAQ 100 index (QQQ), crypto currencies (Bitcoin), and the S&P 500 index are emblematic of this speculative bubble’s climatic top. Recency bias is the phenomenon where investors cling to unsustainable recent growth assumptions and valuations resulting in disappointing investment returns. The chart below of the growth versus value sectors of the Wilshire 5000, illustrates an 8 year period of mean reversion for growth from 2000 to 2008. Consequently, we believe growth investment strategies will lag value strategies from 2021 for a similar time period.
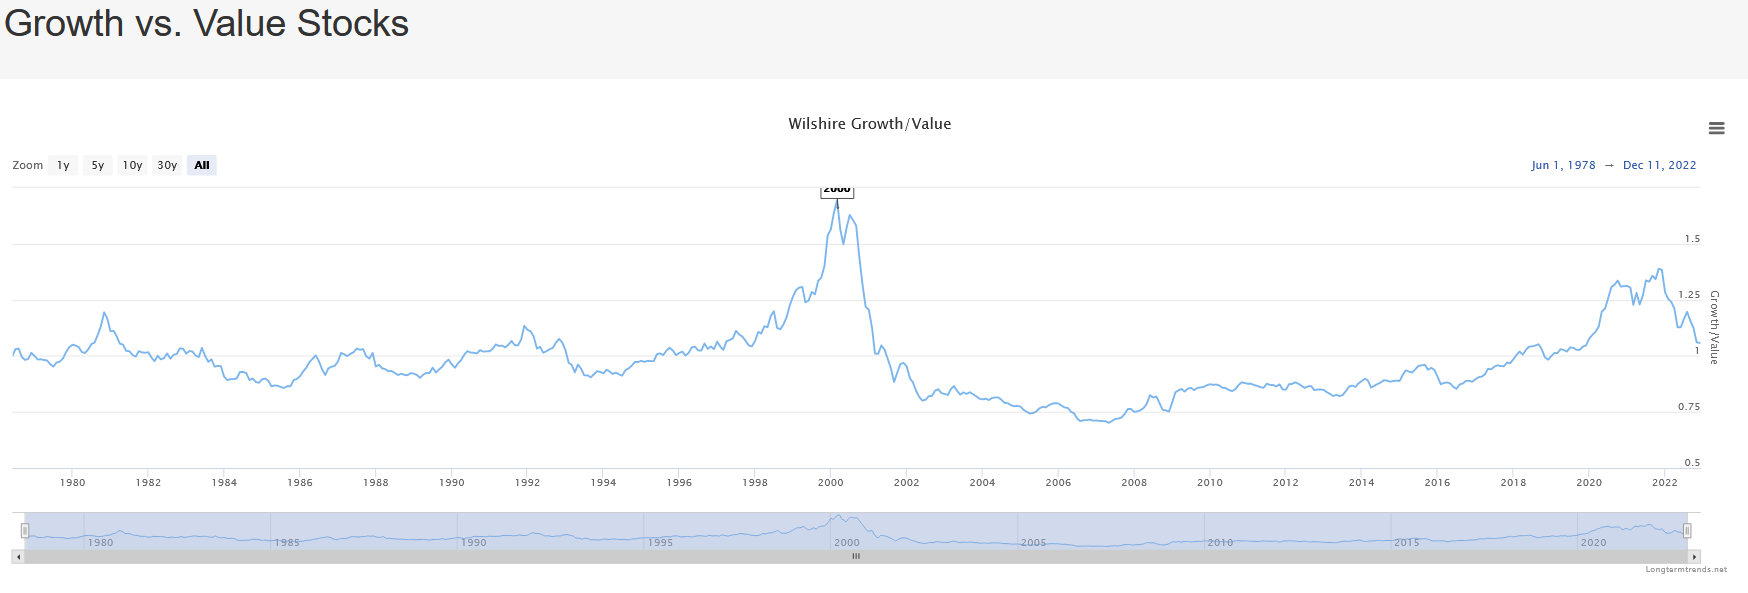
Source: Longtermtrends.net IGA Research
Investing In Commodities:
Since March 2020, we have been quite keen on energy. Investments in MLPs, MLP closed End Funds, natural gas and even coal have performed exceptionally well. While good value and promising earnings should lead to continued strength in energy investments, we now see a compelling case for gold and precious metals as a particularly attractive investment alternative to traditional investments into stocks and bonds.
In new cycles, new leadership sectors emerge. Due to the extraordinary global central bank accommodation since the Great Financial Crisis, many currencies are being debased and central banks are beginning to add to their gold reserves as an increasingly attractive alternative to currencies. For this reason, gold has the potential to experience a multi-year bull market. With the Federal Reserve approaching the end of its tightening operation, the US dollar has put in a top and this should lead to strength in gold over this inflationary commodity cycle.
Quant Strategies Should Lift Gold:
Approximately 80% of publicly traded investing today is quantitatively driven. Top factors like momentum, non-correlation, and inflation hedge benefit should now create new demand for gold.
One of the top factors in quantitative modelling is momentum. Broadly speaking, momentum is moving away from US equities and US bonds, and we believe that gold and other precious metals will be beneficiaries of the shift in momentum from US equities and US bonds. As gold gains traction and momentum, quantitative models will begin to increasingly emphasize gold and precious metals in their models and allocations.
Another quantitative factor portfolio modelers emphasize is the diversification benefit of a particular investment. We believe that gold, precious metals and commodities in general will score higher on a diversification metric over the coming years. Small shifts in diversified asset allocation models can lead to measurable improvements in gold buying and, consequently, gold’s momentum and diversification benefit. This positive feedback loop should reinforce performance and popularity in gold and precious metals in the years ahead.
Gold Cycle Correlations:
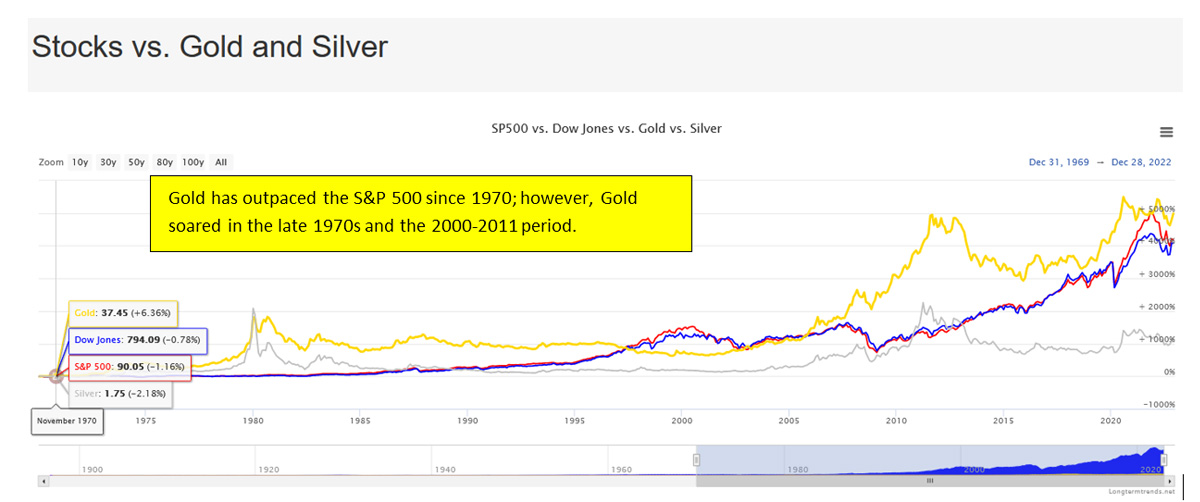
In the inflationary cycles of the 1970s and the 1999 to 2011 period gold performance have been unusually strong when US equities and US bonds have underperformed. The chart below shows a sharp spike in gold in the late 1970s.
Source: Macrotrends.net
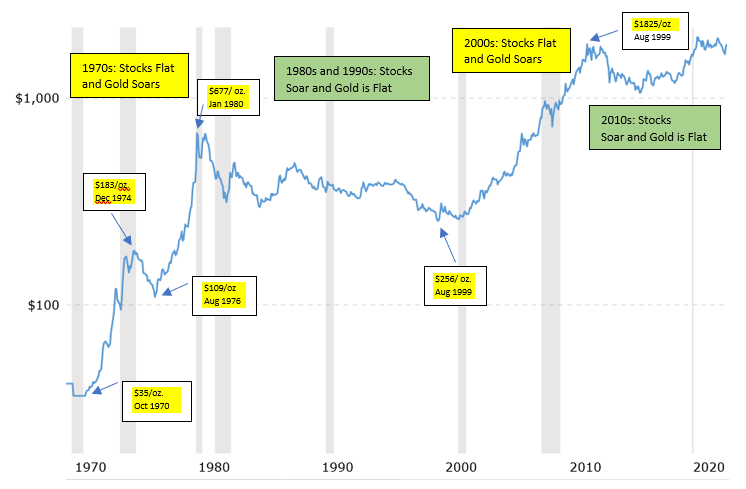
The chart below shows that gold had extremely strong performance in the 1970s when inflation and the Vietnam war created terrible domestic economic conditions. Gold also soared in the post tech bubble period, which we eerily feel is similar to the current period.
Source: longtermtrends.net
Commodities Cycles Driven by Supply:
Global gold production has declined in recent years. The chart below by Crescat Capital highlights significant moves following a contraction in global gold production. Contracting production capacity combined with multiple demand drivers could lead to a multiyear bull market.
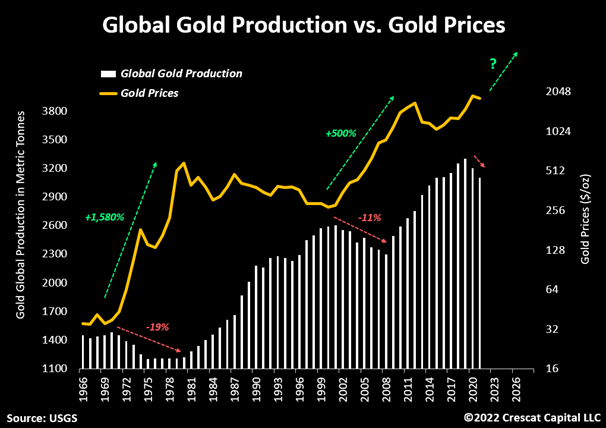
Source: US Geological Survey and Crescat Capital, LLC
These supply constraints magnify the bullish long-term investment case for precious metals. It is important to highlight that during prior periods of similar significant decline in total global production of gold, like that which began in 2020, related mining stocks performed exceptionally well for the next decade.
Recent strength in the oil market parallels the current opportunity. From 2014, ESG mandates led to reduced production capacity in the US. This led to the May 2020 rally from $21/bbl to the May 2022 peak of $116/bbl. The underinvestment in production suggests higher oil price could develop if the US economy experiences a modest recession and China and international demand rebound.
Ironically, mining for green metals has effectively crowded out gold production as miners redirected their capacity to nickel, cobalt, lithium, copper, and zinc mining. Crescat Capital, recently noted several compelling fundamentals for gold:
- “Companies generating near-historic levels of cash flow
- Miners buying back stocks near-record levels at historically cheap valuations
- Highest dividend yields in history
- Highest cash levels in decades
- Lowest P/E ratio for the metals and mining industry since 2008
- Lack of new high-grade precious metals discoveries
- The mining industry as a percentage weight in the S&P 500 Index near all-time lows
- The growth-to-value transition likely to favor highly profitable, low valuation, and counter-cyclical growth businesses such as gold and silver miners today
- Investors increasingly considering gold as the quintessential offensive asset to counterbalance their falling traditional 60/40 stock and bond portfolio
- Most portfolios remain severely under allocated toward metals, especially gold
- Central banks being forced to buy gold to improve the quality of their international reserves
- Precious metals’ prices relative to money supply is near all-time lows”
We see a variety of correlations, historic analogues, growing demand, reduced supply, and quantitative factors which could lift gold in the coming years. If our analysis and expectation for a 700% scale bull market is correct, we look forward to capturing a significant move in the gold and precious metals space as this inflationary cycle persists for the next several years. To capture this move we have bought for our clients the following gold and silver stocks and ETFs.
GOLD – Barrick Gold Corporation
GDX – VanEck Gold Miners ETF
GDXJ – VanEck Junior Gold Miners ETF
SLV – iShares Silver Trust
SILJ – ETFMG Prime Junior Silver Miners ETF
GGN – GAMCO Global Gold, Natural Resources & Income Trust
BLAGF – Blue Lagoon Resources Inc.
SBSW – Sibanye Stillwater Limited
DSVSF – Discovery Silver Corp.
Conclusion:
If your investment opinions are driven by recency bias, you likely are in a 60% stock and 40% bond balanced strategy which will underperform in the years ahead. Our research and experience suggest embracing strategies which are beneficiaries of an inflationary environment to generate attractive returns.
Energy has been a powerful sector since 2020 that has produced stellar returns though, since the second quarter oil price peak and ensuing weakness in natural gas has been humbling. We believe that gold, precious metals, and natural resources should be an excellent source of outsized and non-correlated returns for the rest of this decade.
The known geopolitical risks are China and its potential invasion of Taiwan as well as the Russian invasion in Ukraine worsening. If both these risks fade, a stronger equity market and global economy could surprise the consensus and our expectation for a recession in 2023. Nonetheless, allocations to emerging markets, small capitalization stocks, value stocks, energy, precious metals, money markets, short term bonds will likely lead to superior returns in the years ahead.
Investing has entered a whole new ball game. Avoid recency bias and think differently.
Happy New Year!
Tyson Halsey, CFA
Managing Member