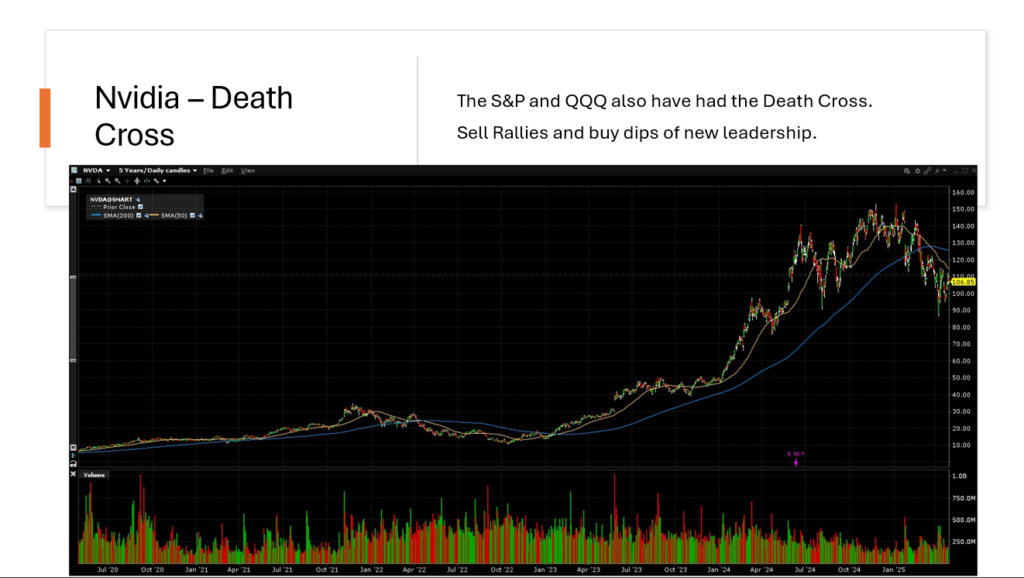
While the Death Cross sounds melodramatic, this technical indicator — when the 50-day moving average crosses below the 200-day moving average – historically precedes every major decline. While not every Death Cross leads to a major decline, it would be foolish to ignore this signal. Since March 19th, the Death Cross was breached by Nvidia (NVDA), the S&P 500 (SPY), and the NASDAQ 100 (QQQ).
Quantitative or algorithmic trading drive about 90% of stock exchange volume, which moving averages illustrate, rank among the top factors in driving portfolio transactions. Momentum drives markets both higher and lower and the Death Cross, shown in the chart below, illustrates that momentum has broken for Nvidia’s stock — the poster child of this artificial intelligence and Magnificent 7 bubble.
We first flagged Nvidia’s parabolic move last July after its market capitalization passed Apple’s and it became the largest market cap company in the world. By definition, NVDA became the largest holding in the market cap weighted S&P 500 (SPY) and NASDAQ 100 (QQQ) indices. Since those indices have also formed Death Crosses, all investors should use this warning to assess their portfolios, asset allocations, and financial plans, because this signal may be as consequential as when it occurred following the 2000 stock market bubble when the S&P 500 declined by 52% and the NASDAQ declined by 83%.
Man is a herd animal. And, as smart as we like to think we are, when the herd changes direction, it is rare when individuals move in opposition to the crowd. For this reason, market tops are often characterized by widespread enthusiasm or “Irrational Exuberance”. Today’s excitement around artificial intelligence mirrors the widespread euphoria regarding the internet during the “dot-com” bubble in 2000.
Nvidia’s death cross signals a serious change in momentum in Nvidia, the S&P 500, the NASDAQ 100, the Magnificent 7 and mega cap growth. This letter will analyze today’s market risks and the benefits of tactical asset allocation strategies capitalizing on the great rotation.
Philosopher George Santayana famously said, “Those who do not remember the past are doomed to repeat it.” Nvidia’s chart below is strikingly reminiscent of the parabolic boom-bust move Cisco Systems, Inc. exhibited in the 2000 technology bubble. While Cisco continued to make money after 2000 and remains a great company today, those earnings did not preclude its earning deceleration and multiple collapse resulting in the 80% decline in its shares following its peak in 2000.

Nvidia today mirrors the mega cap market and Magnificent 7, because it is their largest component. More importantly today’s market closely resembles the 2000 tech bubble as illustrated by the Crescat Capital charts below.

The valuation concerns for the S&P 500 are equally ominous as illustrated below in our chart of the Fed Risk Premium Model. With the risk premium barely positive and the S&P 500 at an 18.55 forward PE multiple, there is little value to compel investors to overweight the S&P 500 in portfolios today.

With the S&P 500 losing momentum and overvalued, we recommend selectively diversifying into foreign and emerging markets, and these markets are enjoying positive fund flows this year. The chart below shows that only emerging and foreign equity markets have positive performance this year.

The Great Rotation is the phenomenon where investment leadership changes. For investors, the great rotation is an opportuntity to improve investment performance by rotating out of overvalued investments into undervalued new leadership. We believe that in addition to emerging markets and foreign equity markets, commodities, precious metals, gold, silver, commodity stocks, small capitalization stocks and value stocks will also be beneficiaries of the great rotation we anticipate over the next decade.
Below are two examples of tactical asset allocation capitalizing on the great rotation phenomenon:
- In the 1990s, I saw John Templeton’s protégé Mark Mobius speak. Mobius said that emerging markets go through boom-bust cycles and they can decline 90%. But, if you buy an emerging market which is down 90%, and it returns to its old highs, you will make tenfold on that investment!
We believe there is great merit in watching the emerging markets in the wake of the Trump Tariff turmoil and believe selective investments could lead to extraordinary returns.
- Rob Arnott, who used to work with bond legend Bill Gross at PIMCO, recently said that from March 2000 to March 2002, the NASDAQ declined 50% but the Russell 2000 small cap value was up 53%. The differential between being in the Nasdaq vs small cap value was 3x.
We have been advising reducing mega cap stocks allocations and adding to small cap stock and value stocks as part of our great rotation investment advice. The examples by Mobius and Arnott underscore how profitable tactical asset allocation can be for investors who sell overvalued bubbles and buy undervalued equities.
Post Market Peak Inflationary Cycles:
Since 1880, we have observed market cycles which are inflationary following major stock market peaks in 1907, 1929, 1970, 2000, and today. Inflationary cycles typically have commodity rallies in oil and gold and the emerging markets, but poor performance in the S&P 500 as was experienced in the 1970s and the 2000 to 2011 period.
We see great potential in emerging markets and gold, in particular, as we believe that we are in an inflationary environment which commenced in 2021 when the CPI began to rise.

The chart below shows gold (GLD), S&P 500 (SPY), gold miners (GDX) and junior gold miners (GDXJ) since 2005. In the 2000 to 2011 period, gold outperformed the S&P 500 and believe that in the coming years gold will again outperform the S&P 500 as it did in the prior inflationary cycle.
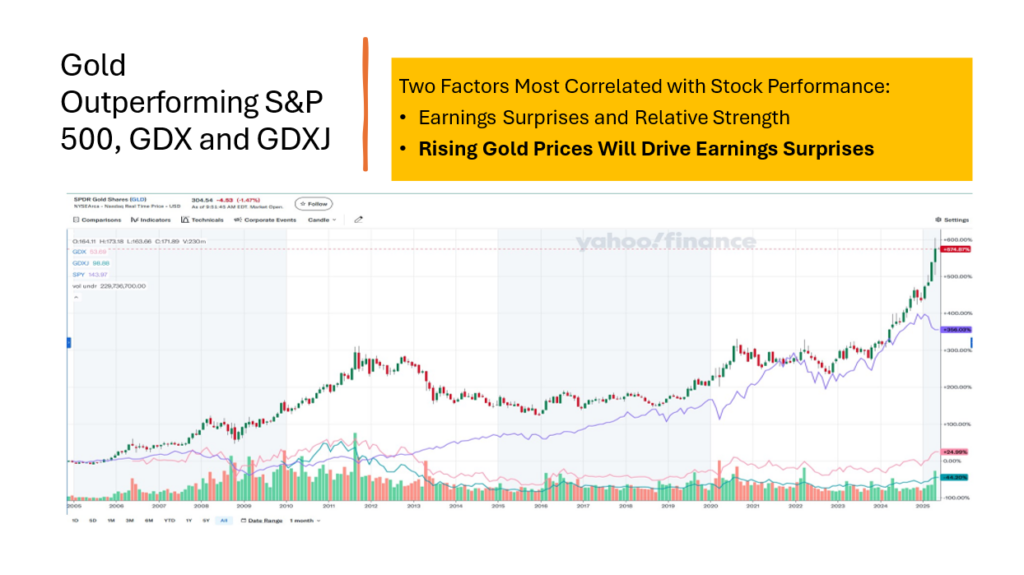
The chart above shows that while gold has nearly doubled since 2011, the gold miners GDX and GDXJ have underperformed the yellow metal performance materially. We feel strongly that the recent rapid rise in the price of gold will now lead to materially higher operating metrics for the gold miners. Gold miner shares are an attractive deep value sector of the market likely to enjoy strong earnings and earnings surprises for the next several years, especially if John Paulson’s forecast of $5000 per ounce of gold in 2028 proves accurate.
The power of the expected earnings growth and prospective earnings surprises is reflected in the chart below which shows a forecasted two year cash flow estimate for the Philadelphia Gold and Silver Exchange which is about 50% higher than the Philadelphia Gold and Silver exchange index chart. One could conclude, as did Tavi Costa at Crescat Capital, that a 50% upside move in gold and silver miners seems logical to restore the price to cash flow gap.

Another way to view this apparent undervaluation is by observing the chart below of the Van Eck Junior miner ETF which is down nearly 66% from its high in 2011, when gold was $1800/ounce nearly one half gold’s current price of $3231/ounce. We believe in a global equity market experiencing high levels of uncertainty due to the Trump Administration’s unfolding new tariff regime, the shares of gold miners are both extremely cheap, but have extraordinarily good and visible earning surprise prospects. For this reason, we see gold shares as a rare investment opportunity for those willing to look away from the fanfare over mega cap technology stocks and artificial intelligence.

Conclusion:
The Trump administrations efforts to reshape global trade has increased business uncertainty globally. Those assets which are most highly valued, like mega cap tech, are most likely to suffer price declines while cheap deep value investments should experience the least price risk as little money has flowed into commodities, foreign and emerging markets, value and small capitalization equities in recent years.
We are already seeing money flow into foreign and emerging markets and those indices are up this year. We believe that as the Trump Tariff negotiations are resolved, great opportunities may be found in the emerging markets. In the wake of the 2000 tech bubble, China entered the World Trade Organization and the China FXI index rose sevenfold. Opportunities could emerge for select emerging markets based on newly realigned trade agreements. For this reason, many countries are engaging with the administration to restructure current relationships before new tariffs are imposed.
Gold miners look especially attractive as their shares are cheap historically and will benefit from rising gold prices due to its direct link to miners’ operating earnings and earnings surprise prospects. This sector is a beneficiary of the Trump Tariff turmoil and is poise to enjoy an extended bull market if our inflationary cycle analogue proves accurate.
Last year we had advised for a 25% cash, 25% commodity, 25% stock and 25% bond asset allocation over the traditional 60% equities and 40% bond allocation. Cash is losing its appeal because rates are declining and believe that lower short term rates will likely ensue. Gold should continue to rise as it is a traditional safe haven, inflation hedge, and central bank purchase and de-dollarization beneficiary. Gold miners which have lagged gold’s powerful rally are especially attractive investments. The only certainty in the investment business is change. We believe we have entered a new era influenced by inflationary cycle trends and an activist Trump Administration. Thinking about where the puck will be rather than relying on past investment returns is especially important today now that Death Crosses have been registered for Nvidia, the S&P 500 and the NASDAQ.