The Global Rotation Continues
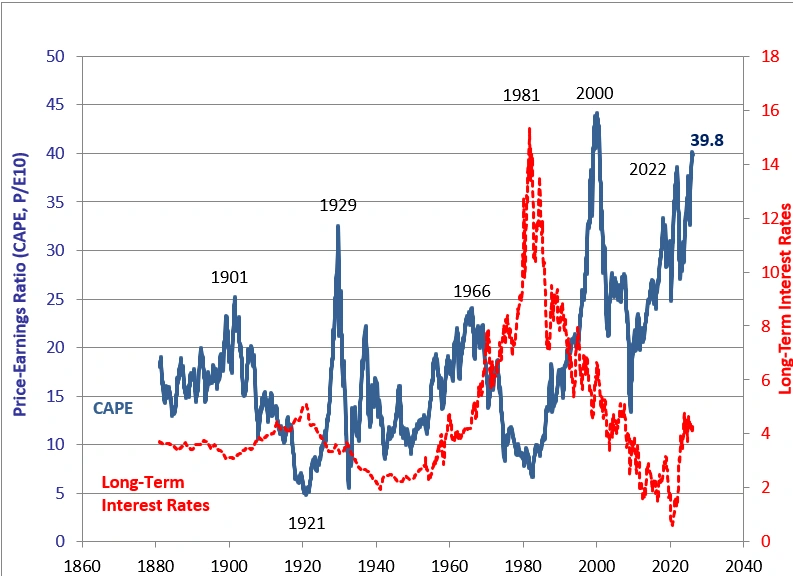
NVIDIA Corporation (NASDAQ:NVDA) reported strong earnings on Thursday and then declined 4% on Friday. When stocks no longer positively respond to good news, seasoned investors believe that all the good news is priced in, and downside risks are increasingly elevated. On Friday evening Operation Epic Fury–the United States’ and Isreal joint attack on Iran–began. This massive military operation designed to de-fang and decapitate Iran’s leadership raises market risks sharply and will create an environment of uncertainty for months. These two factors should weigh on the S&P 500 whose CAPE ratio is 39.8, a near record high, and could possibly mark a top in the S&P 500 and MAG 7 for this bull market.
Below is a chart of the CAPE ratio, the 10-year PE valuation methodology, showing the S&P 500 is near historic peak valuations.
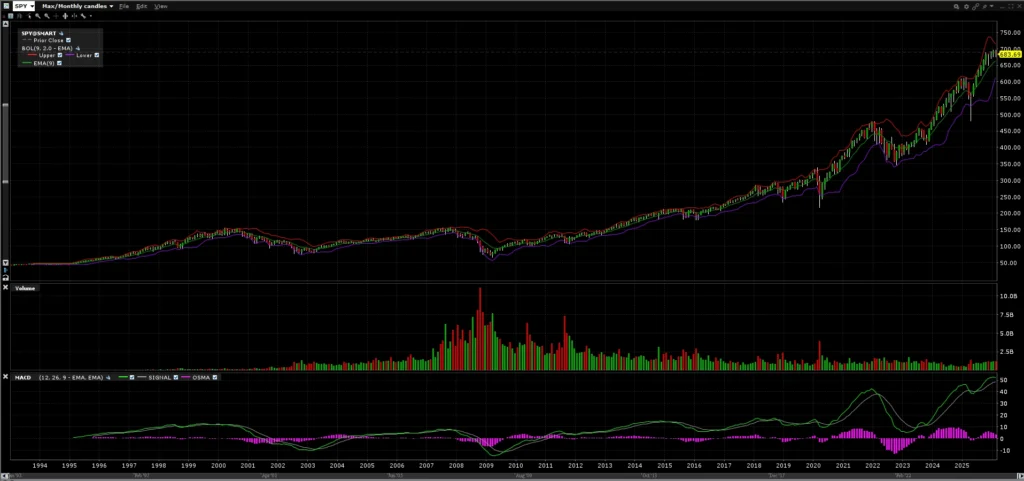
The 33-year chart of the S&P 500 below shows the S&P 500 ETF (SPY) rose ten-fold from March 2009 to March 2026 and tripled from March 2020 to March 2026.
Three Downside Drivers:
Investment icon, Stanley Druckenmiller put out a YouTube video which we believe captures what downside risks exist today in the market. He believes a 30% decline could be in store for us this Fall. While his comments are a bit promotional, he is a brilliant investor who properly sums up the mounting risks of our $38 trillion deficit and debt service burden that should lead to a liquidity drain in the future.
The Yen Carry Trade’s Unwind. For decades, Japan has carried interest rates near 0%. International investors found they could borrow at a near zero interest rate and invest in the US more profitably. Initially, these loans were used to buy US Treasuries, but now investments in the S&P 500 and the MAG7 have also been acquired with these low-cost funds. Beginning in 2024, Japan began raising its interest rates and the “free-money” opportunity began to disappear. With rising rates in Japan, monies invested abroad began to turn unprofitable. We believe that the reversal of the yen carry trade could remove a major source of inflows for the US markets and weaken the US equity market in the future.
The weakening dollar poses another downside risk as 29% of the ownership of US equities now comes from abroad and with a weakening US market and declining dollar, foreign investors are likely to repatriate their US investments and buy foreign and emerging equity markets and sell US equity markets. Losing foreign investors could lead to protracted outflows from the US markets which could then rotate into emerging markets and foreign markets.
More Rotation Than Imminent Collapse:
The US market appears toppy as leading industries are breaking sharply like software e.g. (ServiceNow, Inc (NOW), Microsoft Corporation, (MSFT), DocuSign, Inc. (DOC)); private debt e.g. (Blue Owl Capital Inc. (OWL) and Blackstone (BX)) and crypto currencies e.g. (Strategy Inc. (MSTR)) and Bitcoin (BTC)). With the market uncertainty attendant with war, Operation Epic Fury looks to force markets to deleverage, prepare for higher oil prices, and weigh Iran regime change risks.
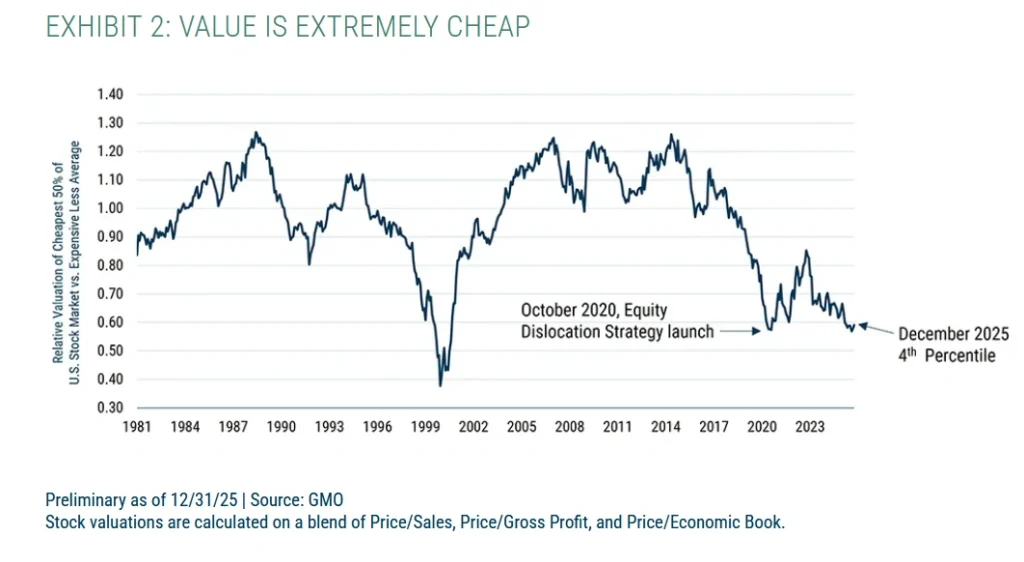
From my post-2000 market peak experience, the best rotation beneficiaries are new low-valuation sectors or geographies which are coming out of prolonged downturns. The chart below from GMO highlights the great opportunity to be found in value stocks.
Due to the weakening dollar, foreign and emerging markets have outperformed. Should the dollar’s bull market since 2011 continue to break down, foreign and emerging markets should continue to outperform due to the dollar and the fact that these markets have been ignored and are abjectly cheap relative to the US.
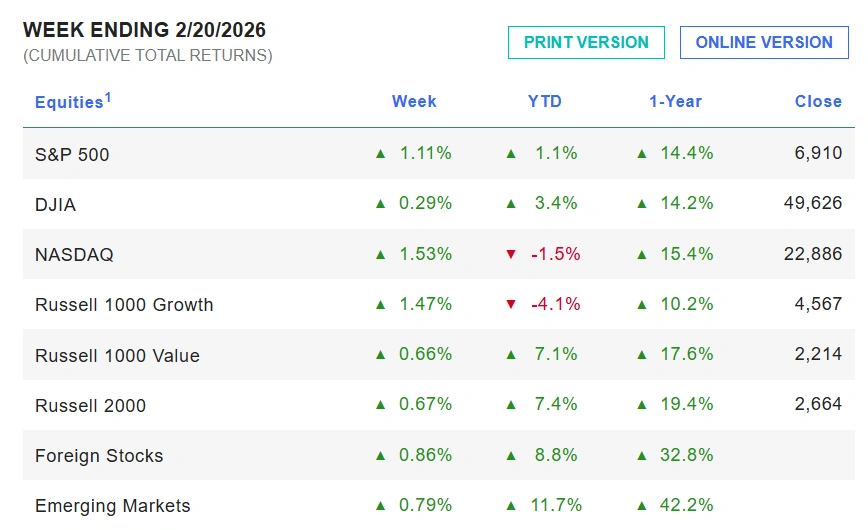
The chart below shows that over the last year, emerging markets are up 42.2% and foreign stocks are up 32.8%. This foreign and emerging market outperformance is likely to stay due to the compelling value case we made for these geographies last month.
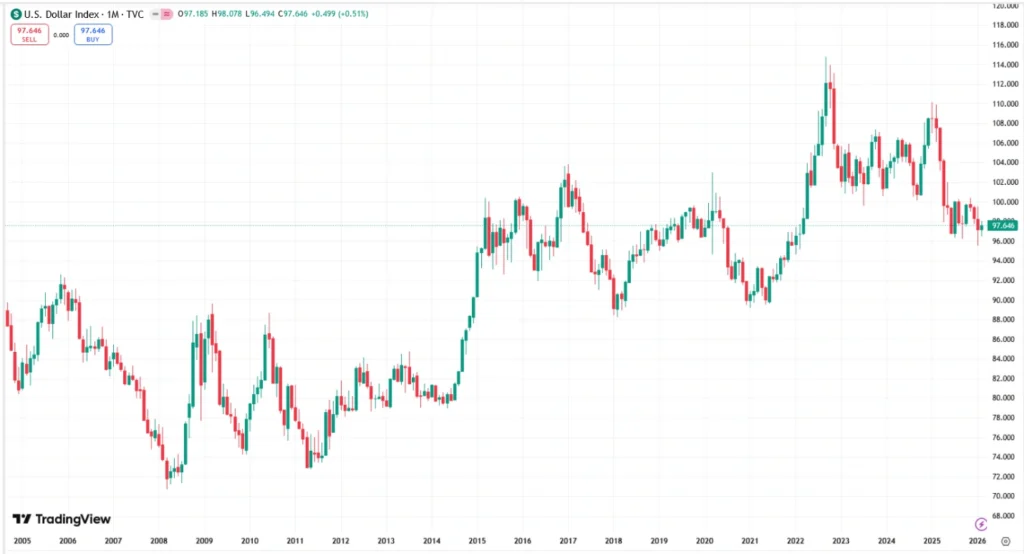
We believe weakness in the dollar will persist in an international global debasement trade following years of dollar dominance since 2011, though a war risk premium may give the dollar a short-term lift.
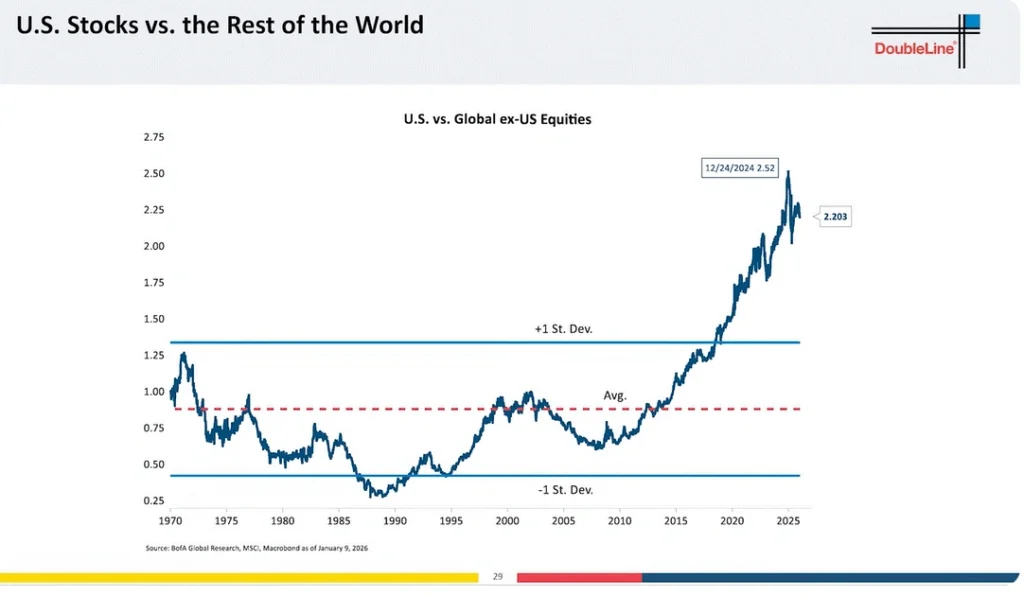
Our case for continued strength in foreign and emerging market is driven by both a weaker dollar and deep value outside of the United States. The chart below from DoubleLine shows the relative overvaluation of US equities versus non-US equities.
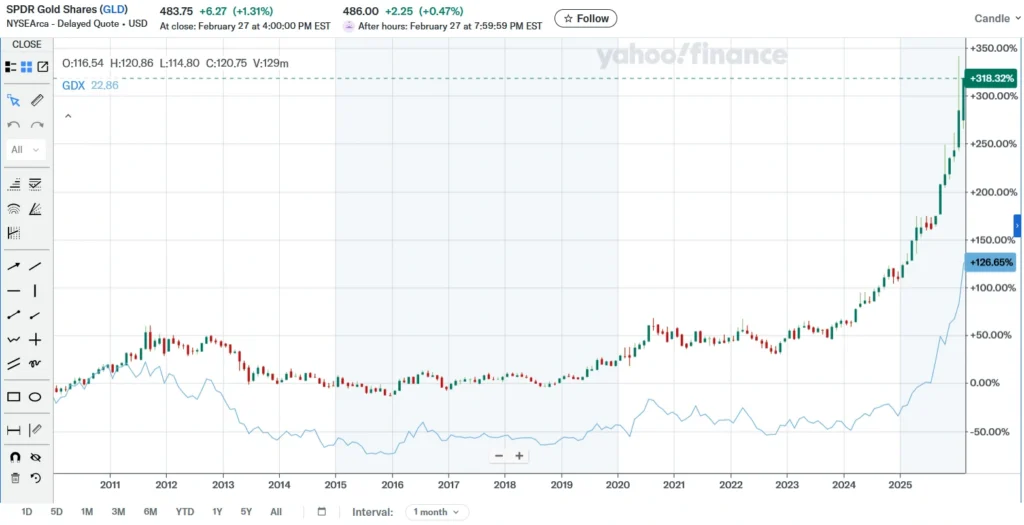
Continued weakness in the US dollar and other currencies should help gold continue to prosper in the future. The chart below shows SPDR Gold Shares (GLD) and the VanEck Gold Miners ETF (GDX) in strong bull markets since 2024, following a 12-year bear market. We believe that gold re-monetization and currency debasement forces could lead to gold and gold miners to continue to do well in the years ahead. We are more inclined to invest in gold miners over gold as gold miners historically lag gold prices and only now are those earnings starting to flow through resulting in solid gold miner share price appreciation. Historically, the gold miners, when gold cycles peak, typically outperform gold – and it is still lagging gold today.
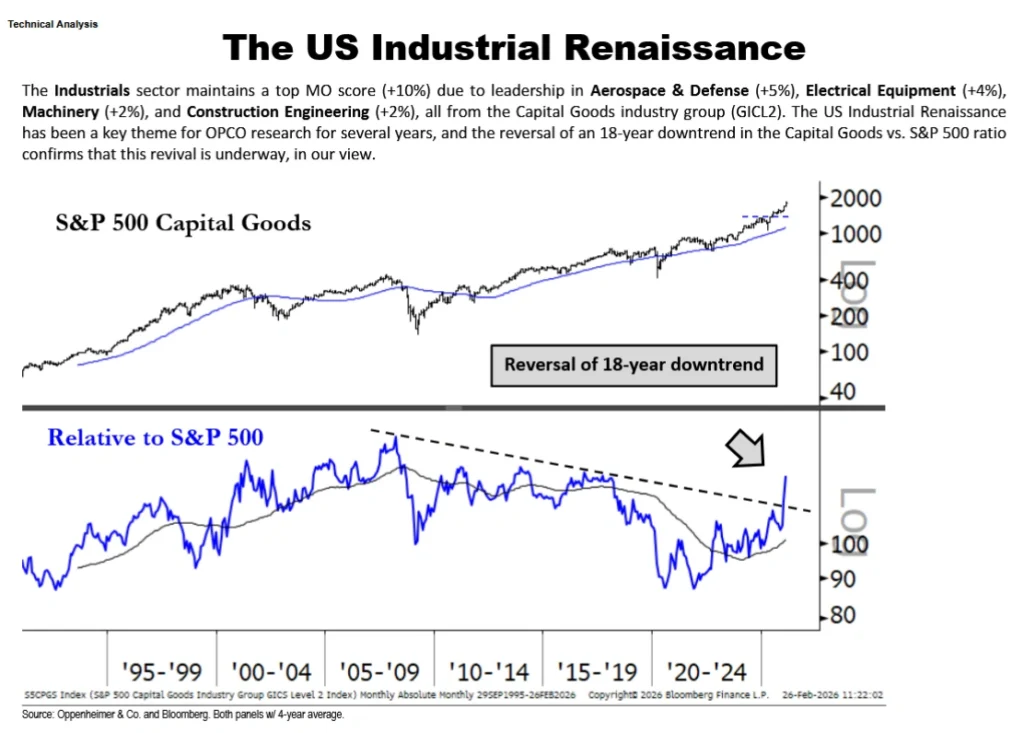
Ari Wald, CFA, CMT, the talented OPCO technician, pointed out six new attractive US sectors to participate in the great rotation. We have highlighted three.
1. The US Industrial Renaissance, which is a logical beneficiary of the administration’s wish to recapture its lost industrial base.
2. The Metals & Mining Super Cycle: have broken out of a 12-year bear market.
This sector has been under capitalized for decades and its potential is reflected in gold miners in the last two years. Now, other metals and miners are moving up and following gold.

Energy is always in demand and now those demands are growing due to global growth, the electrification of transportation, datacenter power needs, and industrial growth. Energy as shown by the S&P Energy ETF (XLE), has just broken out after 12 years of consolidation.

Commodities vs S&P ratio:
The ratio of the commodities to the S&P 500 index has been a useful tool to direct when to overweight commodities relative to the S&P 500 Index. The chart today appears to show that commodities should be overweighted in portfolios and the S&P 500 should be underweighted. In fact, the ratio charted below, looks like it is reversing and I would expect a more commodity centric portfolio will rise for the next three to ten years.

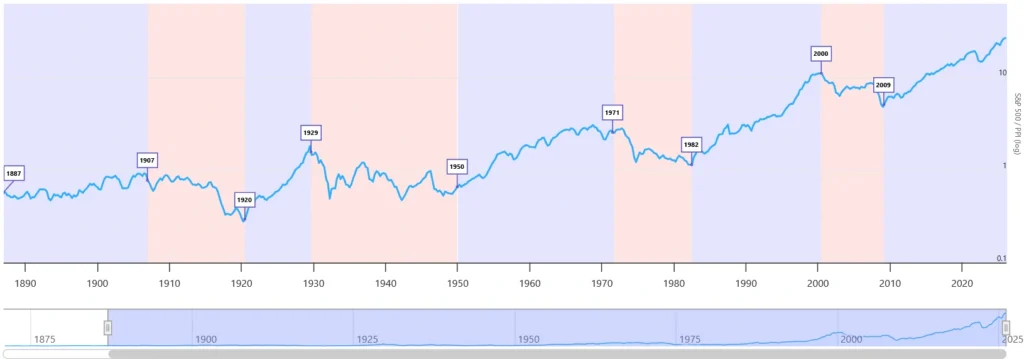
Inflationary Deflationary Cycle
Since 1887, the ratio between commodities and the S&P 500 have shifted between periods of inflation and deflation. When inflationary cycles are in place, and we believe we are entering an inflationary cycle, commodities and commodity stocks will significantly outperform the S&P 500. This was true in the 1970s and the 2000 to 2009 period. During those periods gold and oil prices rose and the S&P underperformed and was basically flat for a decade. That is what we see happening now. Sell the S&P500 and MAG 7 stocks and buy commodities, commodity proxies, and international stocks.
Conclusion:
The rotation toward commodities and away from mega capitalization technology stocks appears to be accelerating. We believe that with Operation Epic Fury and NVIDIA’s sell off in the face of good earnings may signal a sea change or market top in a rotation away from the S&P 500.
If this cycle shift is correct, significant upside can be achieved by investing in commodities, commodity stocks, gold, oil, energy, industrials, and foreign and emerging equity markets. By allocating away from overvalued stocks into new sectors that are fundamentally inexpensive and breaking out after long periods of consolidation, we believe a flat S&P 500 should not impede investors from healthy returns in the stock market. However, recency bias will likely trap many investors in the winners of the past such as software, crypto, and private debt. We believe new economic factors will drive new leading sectors and shift allocation models away from the 60% equity 40% bond allocation to a 25% cash, 25% commodity, 25% bond and 25% stock allocation since the fundamental factors now driving the economy have changed.