Capital market leadership is rotating due to global currency debasement and shifting investment trends and models. Changing fundamental factors and attractive valuations are driving strength in commodities for their diversification, inflation resilience, and exposure to global growth. We foresee a continued late 2020’s rotation into gold, commodities, and out of the historically overvalued S&P 500 and mega cap tech stocks. Undervalued sectors and geographies like emerging market equities, international equities and commodities will be this cycle’s new leadership. Investors are rotating from the traditional allocation models like the 60% equities – 40% bonds into new allocation models which emphasize weak dollar beneficiaries and value investments like 25% commodities, 25% stock, 25% bond and 25% cash.
Current Market Risks:
Several risks are creating volatility in global markets. Most importantly is the “Yen Carry Trade” which have provided enormous cheap money for global capital markets for years. With Japanese yields rising, we see the yen carry trade unwinding and leading to liquidations of leveraged investments globally. A significant back up in interest rates occurred before the October 19, 1987, “Black Monday” 22.6% market crash.
Private debt markets appears to be in a bubble, and problems in private debt could also pressure capital markets by draining liquidity from the markets. Blue Owl Capital, Inc. (OWL), Ares Management Corporation (ARES), TPG Inc. (TPG) and KKR & Co. Inc. (KKR) are leading alternative asset managers whose stock prices have slumped sharply this year and could add to market contagion this year.
Crypto Currencies are also breaking down. Strategy Inc., the Bitcoin Treasury juggernaut, is also struggling as its net asset value continues to decline with Bitcoin prices.
The S&P 500 is losing momentum following a three-fold run since its bottom in March of 2020.

Lastly, the Shiller CAPE Ratio of 39.8 shows the S&P 500 is near 140-year high valuations.
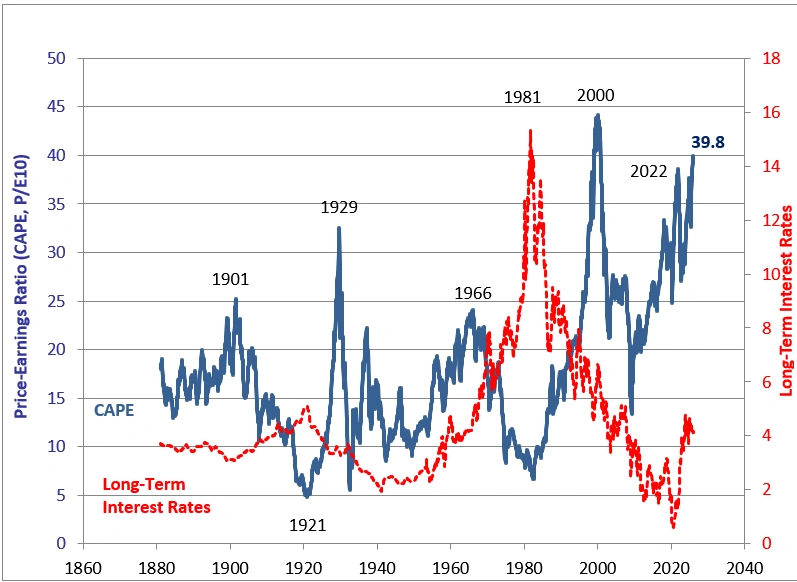
This combination of risk factors suggests the equity market is topping and a cycle shift or market rotation could be at hand.
The New Inflationary Cycle:
Over the last 140 years, inflationary and deflationary cycles have driven sector and asset class performance. The chart below of inflationary and deflationary cycles suggests that the S&P 500 will underperform in the years ahead while commodities, miners and international equities will outperform. Historic analogues to our forecast are the 1970s and the 2000 to 2011 period.
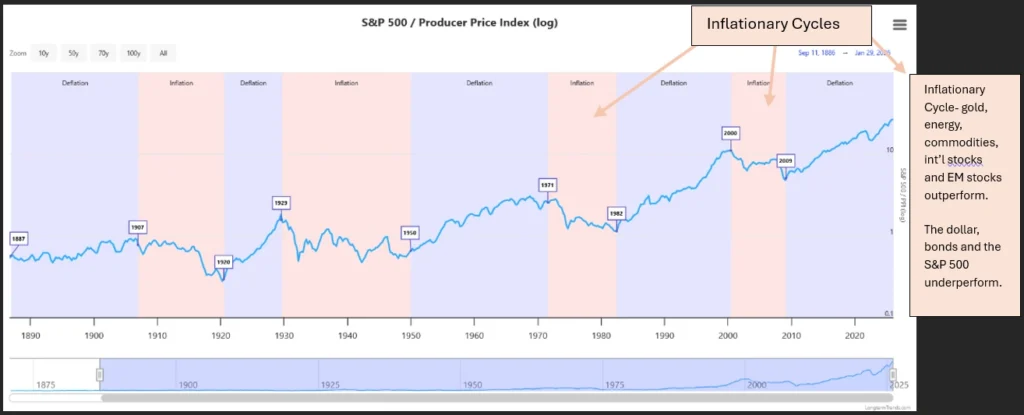
The chart above of the ratio of the S&P 500 divided by the log of the Producer Price Index shows 10-to-20-year periods where inflationary periods or deflationary periods define investment leadership. During inflationary periods, gold, oil, commodities, and non-US stock markets outperform while the dollar declines. During deflationary cycles, the S&P 500 and bonds outperform as they have done since 1981, save the 2000-2009 inflationary cycle. We are in a new inflationary cycle. Our market cycle research and Bannister and Forward’s suggest commodities and equities are negatively correlated and that their market leadership rotates every 10 to 20 years.
The Case for Commodities:
The chart below of the Bloomberg Commodity index suggests that commodity prices are improving with growing global demand for an electrical grid, data centers, AI computational infrastructure and reindustrialization. Historically commodities are inversely related to the S&P 500, so, when commodities are outperforming other assets, money flows into these sectors which then provides capital to sectors like mining which have been capital constrained. The mining sector has been deprived of development capital for years if not decades. Consequently, we see a secular shift favoring mining relative to the S&P 500.

The Switch to Commodity Leadership:
The chart below shows the ratio of the S&P GSCI to S&P 500 is turning up and perhaps igniting a period of commodity outperformance (when this line is trending higher) for the next couple years or decades.

The Golden Opportunity:
Historically monetary metals, like gold and silver, have been hard currencies and are a special subset of the commodity sector was which benefit from the declining global monetary system. Jim Grant recently said that the price of gold is the reciprocal of the markets’ confidence in central bankers. Consequently, as paper currencies debase with spiralling government debt and deficits, the price of gold and silver should continue to rise.
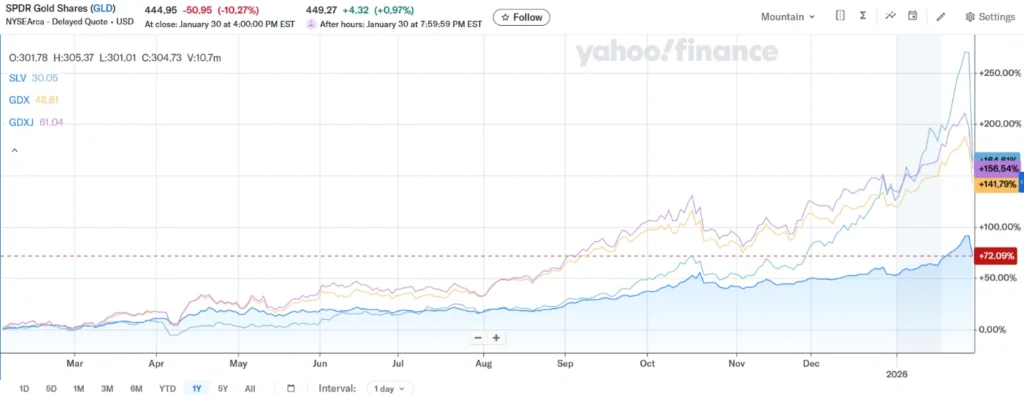
Last year, in 2025, some of the world’s top performing investments were in the monetary metals complex. The chart below from, January 30, 2025 through January 30, 2026, shows ETFs SPDR Gold Shares (GLD) up 72%, iShares Silver Trust (SLV) up 164%, Van Eck Junior Gold Miners ETF (GDXJ) up 156% and VanEck Gold Miners (GDX) up 141%. In addition to providing extremely high investment returns, monetary metals and their miners are negatively correlated to the S&P 500. Consequently, portfolio managers should find the monetary metals complex as a compelling source of alpha and non-correlated returns.
The Metal to Miner Lead-Lag Relationship:
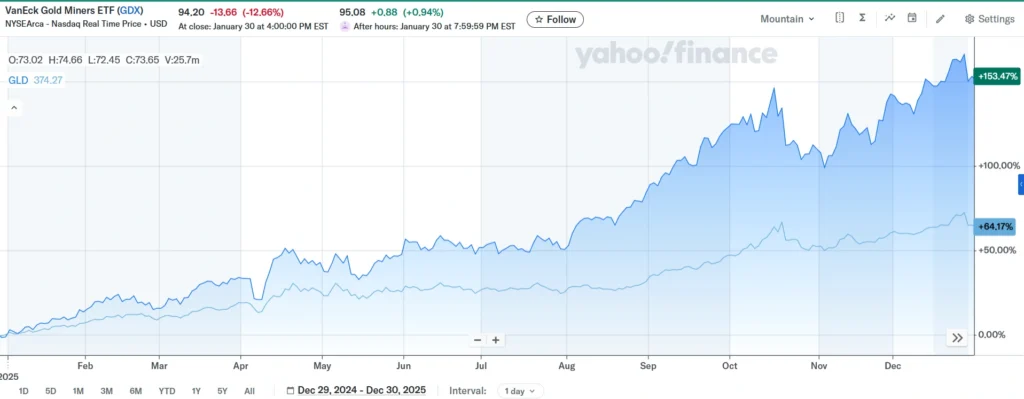
There is a lead-lag relationship between a metal’s price and a miner’s price. The metal price will rise first and then as those higher prices increase revenue and income, those miners’ shares rise rapidly to catch up with the performance of the underlying metal. In 2025, gold rose 64.17% but the gold miners ETF GDX up rose 153%, catching up for gold’s outperformance in 2024. Junior or emerging miners, who often don’t generate revenues, should see the biggest moves as elevated gold and silver prices allow for significant earnings increases driven by higher precious metals prices.
Monetary Metals ETFs since 2009:
The lead lag effect is shown more clearly over the longer-term chart below with: SPDR Gold Shares (GLD) up 284.77%, iShares Silver Trust (SLV) up 321.79%, VanEck Gold Miners Index (GDX) up 84.31%, and VanEck Junior Gold Miners ETF (GDXJ) up 13.97%. The chart below shows how, when the sector last peaked in 2011, silver rallied well past gold, and junior gold miners rallied well past gold miners. Based on the 2011 historic analogue of the last peak, we believe that we will see years of further appreciation before this sector peaks. That peak should be marked by parabolic moves in silver and junior miners which sharply exceed previous highs.
Our forecast lends credence to Pierre Lassonde’s recent views. Gold icon and Franco Nevada founder, Pierre Lassonde, recently state that he expects gold at $17,250/ounce in 2032 in a recent YouTube video. (1:58 min.) Lassonde argues the gold is being “remonetized” and it is showing up on Central Banks’ balance sheets in larger proportions as the allocation to fiat currencies is declining. Lassonde argues that most developed countries are running unsustainable debts and deficits and will be forced to deflate their currencies as they have historically when government’s finances have failed to remain sustainable. Junior gold and silver producers will have the greatest investment return potential as they turn profitable. Before this cycle peaks, higher metals production will be needed and higher gold and silver production has barely started.

Consequently, we expect exploration and mining capacity to grow in the years ahead and do not forsee supply sufficient to end bull markets in gold, silver or commodity metals for at least three years.
Longer Term Case for Miners
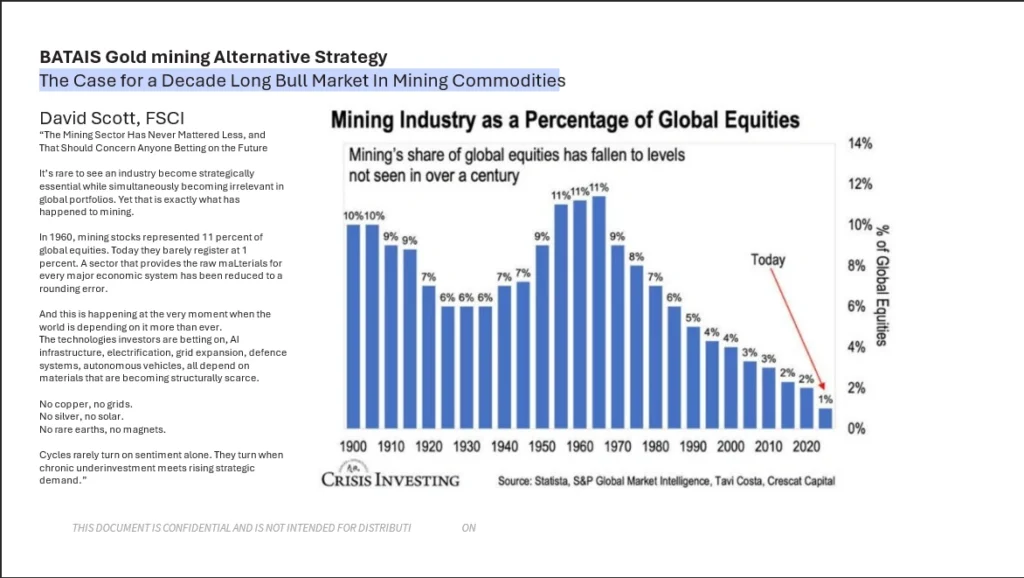
Demand for miners will be essential for global growth and economic advancement. We currently are at a cyclical bottom in mining with mining equities only 1% of total global equities, down over 90% from their 11% market share in the 1960s.
Gold Market Drivers:
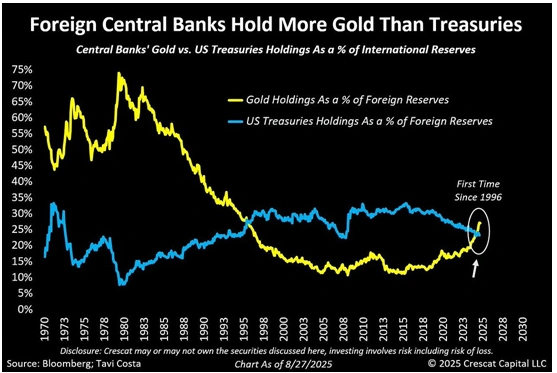
The chart below shows one of the major drivers of gold demand for the years ahead. Foreign central banks are now buying more gold than they are buying US Treasuries for the first time since the 1996. Massive foreign central bank gold purchases should persist until countries’ currencies have stablized.
Additionally, the exceptional performance of gold and gold miners have led to several well know investment professionals like DoubleLine’s CEO Jeffrey Gundlach who advocates up to 25% in gold in modern portfolios. Likewise, Bridgewater’s Ray Dalio similary has suggested a 20% allocation split between the metal and the miners. JP Morgan recommends 20% of portfolios invest in gold. Since gold is only about 2% of portfolios today and down from 11% in 2011, we foresee years’ of persistance growth in demand from traditional individual and institutional US investors.
High Debt to GDP Ratios Debase Currencies:
US Debt is $38.5 – 39 trillion and the US GDP is about $30.8 trillion. The US Debt to GDP of 125% is the highest since World War Two.
Global Debt to GDPs in 2025: US 124%, Japan 236% to 249% of GDP, France 116-117% 2025, and Italy 137%.
The United States, Japan, France, and Italy have been spending beyond their means. This reckless spending has created the currency debasement phenomenon that has helped fuel the bull market in gold.
Borrowing from Peter to Pay Paul:
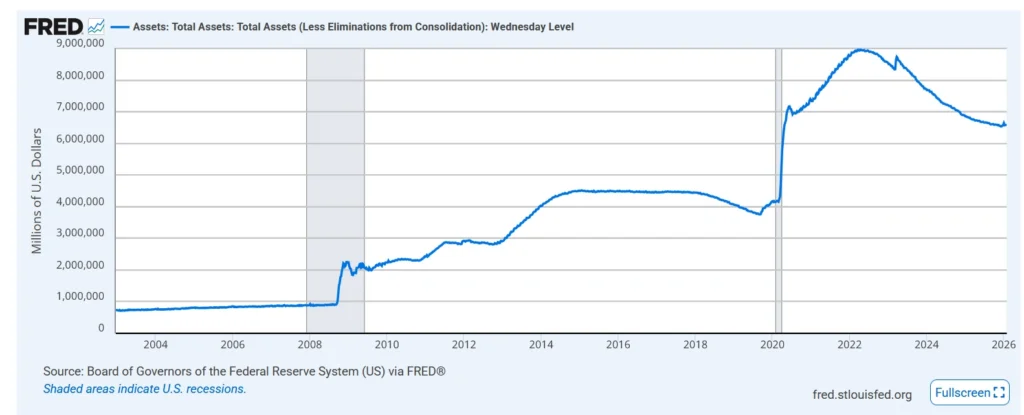
Since the 2008 financial crisis, the Federal Reserve has used its balance sheet to buy US Treasuries. This is the type of financing scheme, where one part of government lends to another to allow it to raise capital that leads to currency debasement. The chart below shows how the Federal Reserve has grown its balance sheet through the purchase of US Treasuries and contributed to the debasement of the US dollar.
The Chart below shows the 6-fold growth in trillions of Debt held on the Federal Reserve Balance sheet since before the 2008-9 global financial crisis.
The process of having the Federal Reserve buy nearly 10 trillion dollars in US treasuries is precisely the type of circulatory finance which has led to inflation and currency debasement which is at the heart of the global debasement trade and Pierre Lassonds’ gold re-monetization process that is driving higher gold prices in the future.
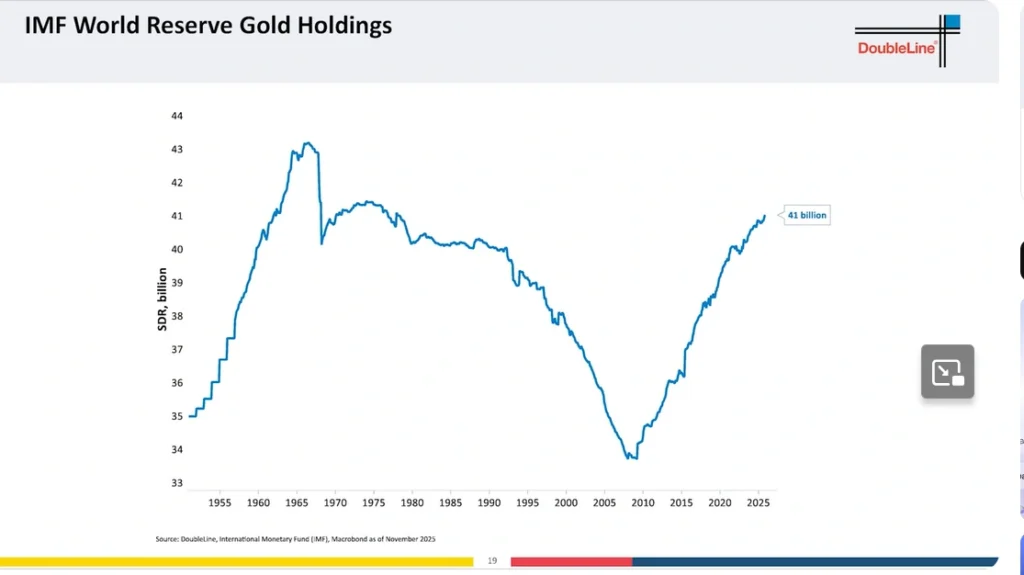
The rise in global gold holding in Central banks.
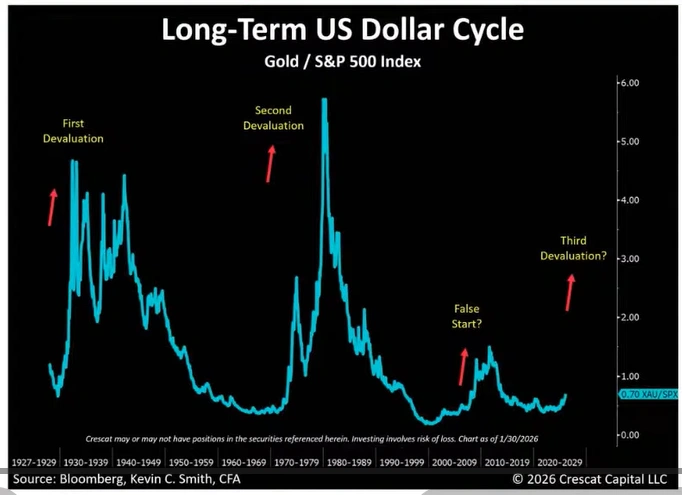
The chart below by Crescat shows the historic cyclicality of rising gold prices with dollar devaluations since 1929. The chart also shows that gold, relative to the value of the S&P 500, is at a cyclical low and could grow by multiples in future years.
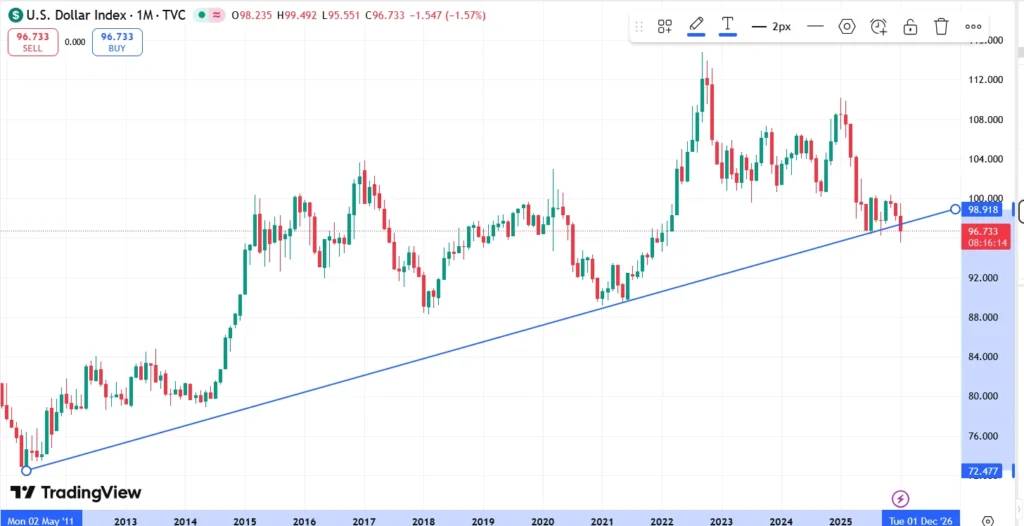
The Dollar is Declining: The chart below by Oppenheimer’s Ari Wald suggests that the dollar is on a critical support line for the DXY at 96.

Our own chart show the dollar is also at a critical support line.
The Case for Non-US Equities:
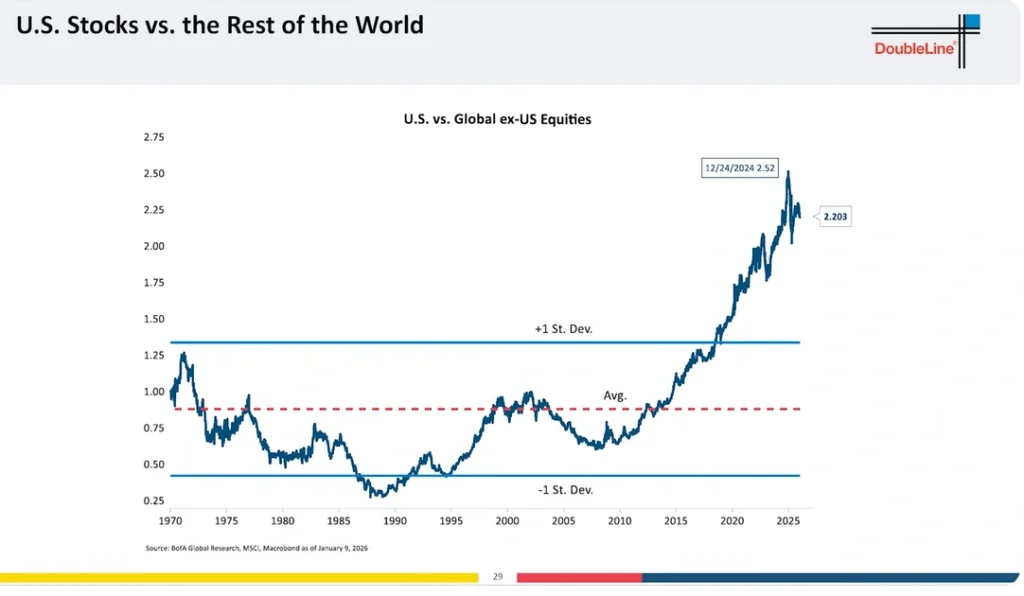
Non-US equities should benefit from two important factors. First, non-US equities are historically inexpensive compared to the S&P 500. The case for non-US equities is shown below by DoubleLine’s iconic CEO, Jeffrey Gundlach. The first chart is of the ratio of the US equities divided by total global equities ex-US equities. And that ratio valuing US equities about 2.2 times the mean. So US equities are overpriced and Non-US equities are cheap.
This second valuation shows that MSCI USA Index Book Value trades at a 150% premium to the non-US MSCI Index Book Value. Again, US equities are expensive to non-US equities by a significant factor.

Both a share price and a book value basis, DoubleLine shows foreign markets are demonstratively cheaper than the US. If the US dollar declines, then currency benefits will also accrue to inexpensive non-US markets as well.
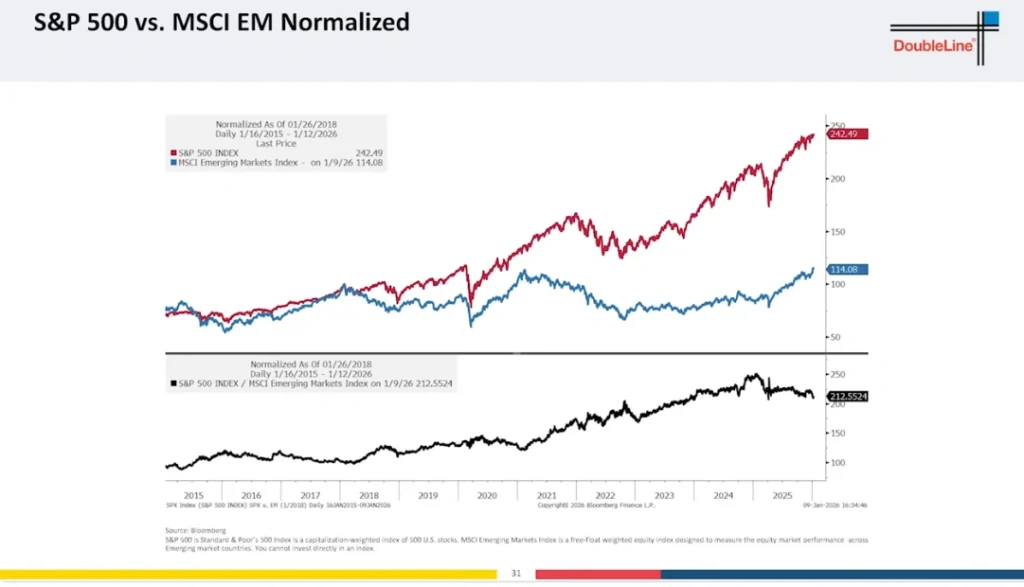
When emerging markets are compared to the S&P 500, in the chart below, we see, since 2018, significant out performance of the S&P 500 versus the Emerging Markets. However, in the lower pane, the black line showing the ratio of the S&P 500 to the MSCI Emerging Market Index began to decline starting in early 2025 when emerging markets began to outperform the S&P 500.
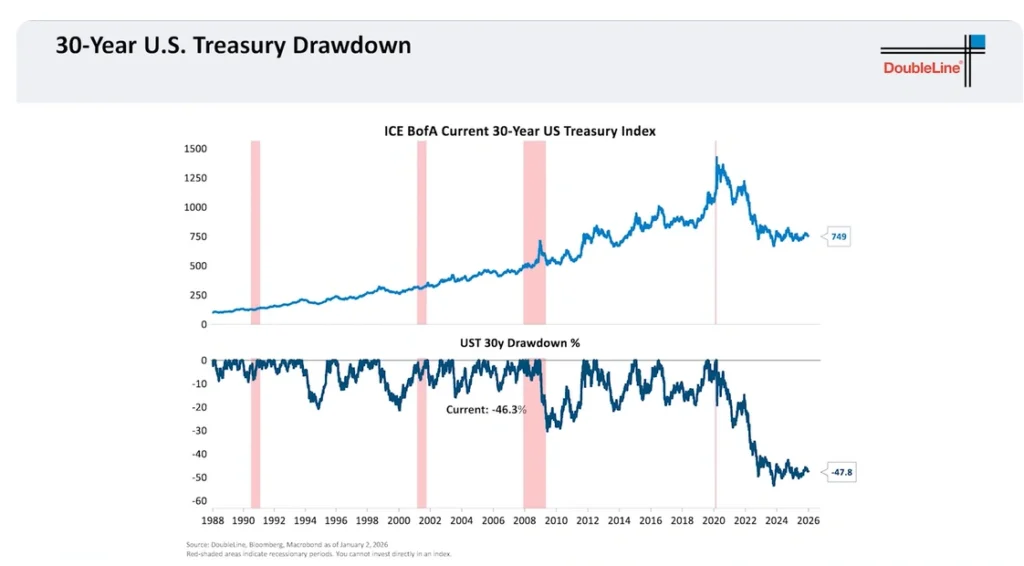
This Inflationary Cycle Has Debased the Appeal of US Bonds:
The chart below shows that the historic return performance of US Treasuries has collapsed following 2020. Furthermore, this underscores the flaw in the 60% stock 40% bond allocation if the bond portion is US Treasury Bonds. US bonds no longer are the compelling safe haven investment for portfolios and could easily be replace with gold for a wide range of investors in the future.
Last year’s asset class performance record shows that new performance leadership is now in non-US equities: MSCI Europe (35.4%), MSCI UK (35.1%), MSCI Japan (24.6%), MSCI Emerging Markets (33.6%) and commodities like Gold (64.4%), Copper (41.1%) and Industrial Metals (21.4%).

Conclusion:
The market appears to be transitioning from a deflationary cycle which favors the S&P 500 and bonds to an inflationary cycle which favors gold, commodities, foreign equities and a weaker dollar. Given the enormous run in the S&P 500 since 1981 and March 2020, we believe that the S&P 500 is overvalued and at risk of losing its prospective performance leadership position for the next several years. Alternatively, we now believe there is real investment appeal in owning non-US equities where there is a compelling valuation case and weak dollar benefit to their investment appeal.
Demand by foreign central banks and asset allocators to increase gold ownership in portfolios appears to be a durable new trend which should support precious metals. Furthermore, the supply of precious metals should not materially increase in the near term as development of a new mine can take 10 to 15 years. For this reason, we believe mining and precious metals mining could be a sector with significant return prospects for the next decade. We believe portfolios should own about 25% gold or monetary metals in a portfolio allocated 25% commodities, 25% stocks, 25% bonds, and 25% cash for the next several years.
While owning ETFs in the monetary metals complex is the safe and conservative way to gain exposure to monetary metals, we believe that there are potentially massive return opportunities in gold miners like Blue Lagoon Resources, Inc. whose nascent mining and promising resource potential is largely unknown. Due to our visit exemplifies potential high return