The current market environment is unpredictable. A few months ago, most economists were forecasting a recession in 2023, but in recent months persistent consumer spending, strong employment, and solid GDP data suggest a recession is increasingly less probable. Furthermore, the Ukrainian resistance is making Russia’s invasion look increasingly like a failure which could lead to the unseating of Vladimir Putin, which would be a huge geopolitical success for our country. Furthermore, China’s abrupt end to its Zero-COVID policy could lift the world’s second largest economy and aid a global economic recovery. These unpredictable and consequential risks make traditional market, economic, and investment forecasting difficult. Fortunately, our research of past market cycles could help your investment strategy to generate meaningful outperformance.
We believe the 1999 to 2008 investment period is a good macro-economic and market analogue to today’s environment, providing useful precedent and insight for the rest of the decade. From 1999 to 2008, oil prices rose from $20/bbl to $175/bbl and technology stocks, from peak to trough, declined 83%. The recent booms in oil and technology stocks, particularly the bubble in the FAANG stocks, crypto currencies, and NASDAQ 100 (QQQ), resemble the 2000 technology bubble period. Furthermore, the September 11 2001 attack led the US into wars in Iraq and Afghanistan, which parallels today’s Ukrainian mission creep.
The tail wind of declining interest rates have had a powerful positive impact on the return history of stocks, bonds, and real estate over the last 40 years. Because these asset classes generate steady income streams — and income streams are valued off of interest rates — the golden age for equity, bond, and real estate returns has ended and new investment allocations should be sought. Since China’s entry into the World Trade Organization in 2001, the United States was a massive beneficiary of disinflation through “offshoring” – the exportation of manufacturing to China. With the increasingly militaristic behavior of China and its threats toward Taiwan, that honeymoon period is over. In the wake of the COVID-19 pandemic, offshoring is being replaced by onshoring, resulting in the reversal of another important disinflationary factor impacting the last two decades. Furthermore, the energy crisis and energy transition will likely drive costs higher as fossil fuels are phased out over the next few decades.
The fourth challenge investors face is their innate proclivity toward recency bias. We believe that investors grow comfortable with past performance and don’t change investment strategy when there are sea changes in fundamental factors and market cycles. From 1999 to 2008, investors were rewarded by investing in commodities, energy, oil, gold, small capitalization stocks, value stocks, and the emerging markets. Many investors stuck with past leaders while ignoring the areas that had been dormant, ignored, and inexpensive. We believe that moving out of large capitalization growth stocks, technology stocks, and the 60% stock 40% bond portfolio will mitigate recency bias. Furthermore, we believe investing in commodities, energy, oil, gold, small capitalization stocks, value stocks, and the emerging markets is a good step toward transitioning to the new leadership of the coming decade.
Technology Is Still Risky:
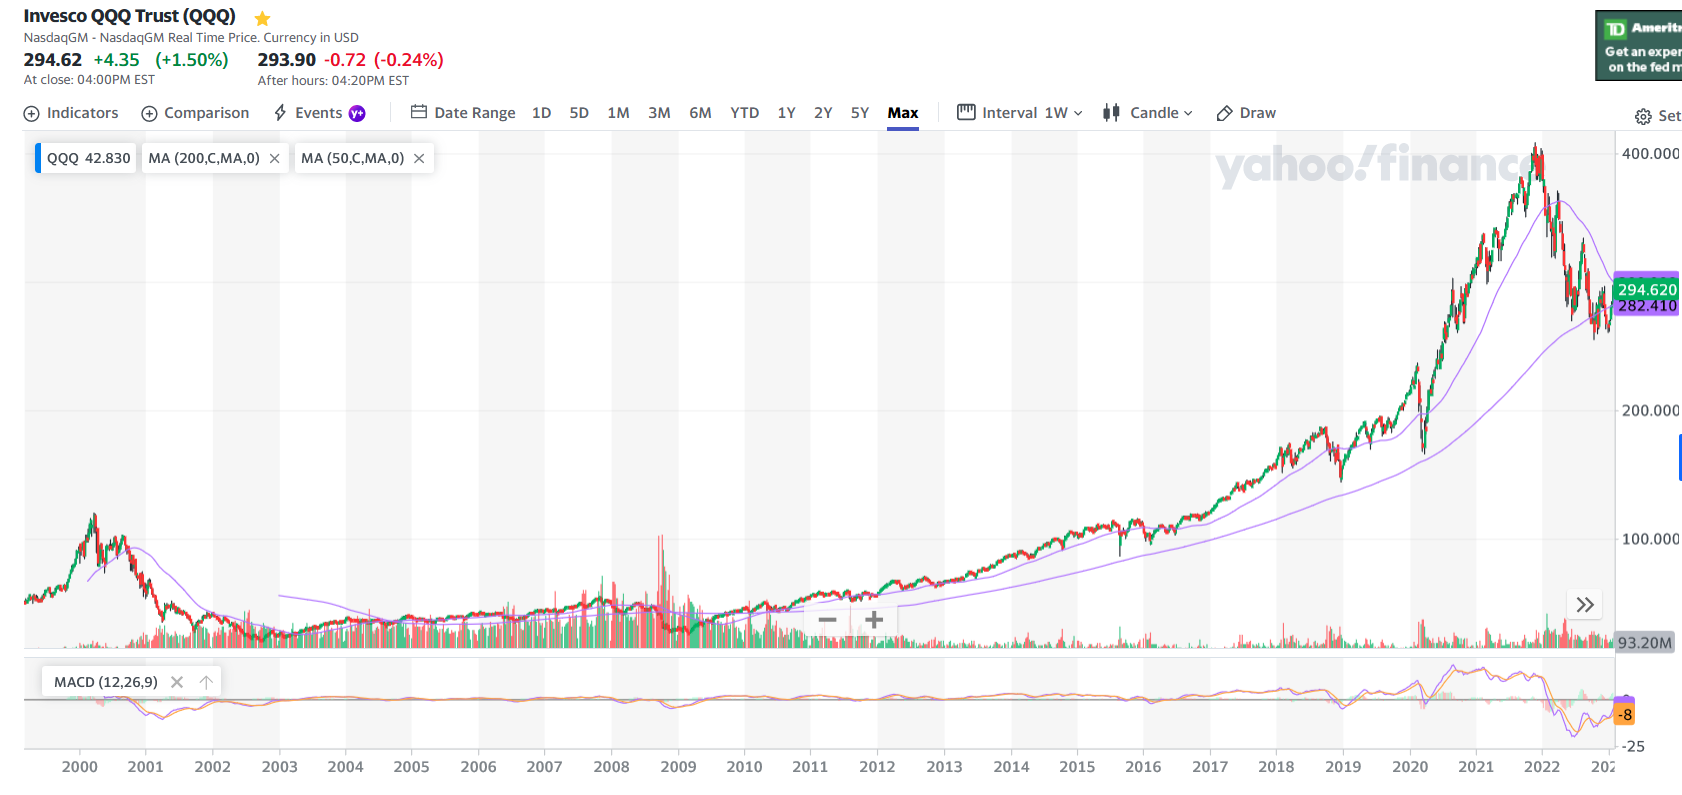
Below is a chart of the QQQ since 1998. It shows the 2000 technology bubble led to an 83% decline in the NASDAQ 100 (QQQ). Furthermore, it took until 2008 nearly a decade for the NASDAQ to begin a new bull market. Today’s tech investors may rue the day of momentum chasing and fear of missing out “FOMO” when years of consolidation are the precedent following a parabolic market move.
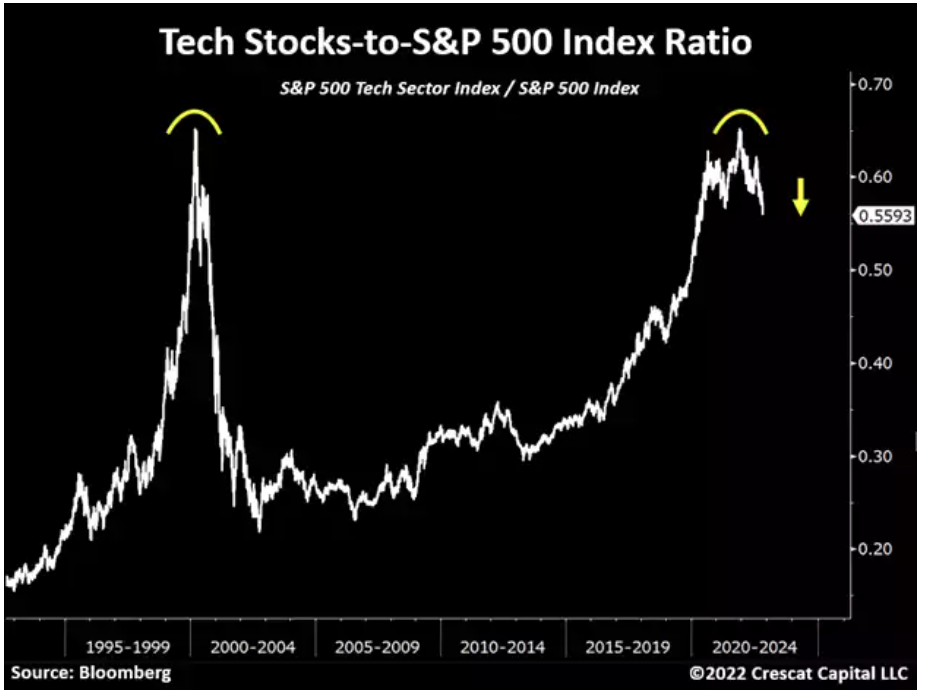
Below is another chart which shows the technology sector divided by the S&P 500 since 1992. From the peak of the 2000 tech bubble, it took five to eight years before the QQQ began outperforming. We believe this technology and large cap growth bubble will take years to unwind. We advise selling tech and large cap growth on bounces.
Rotation to Commodities:
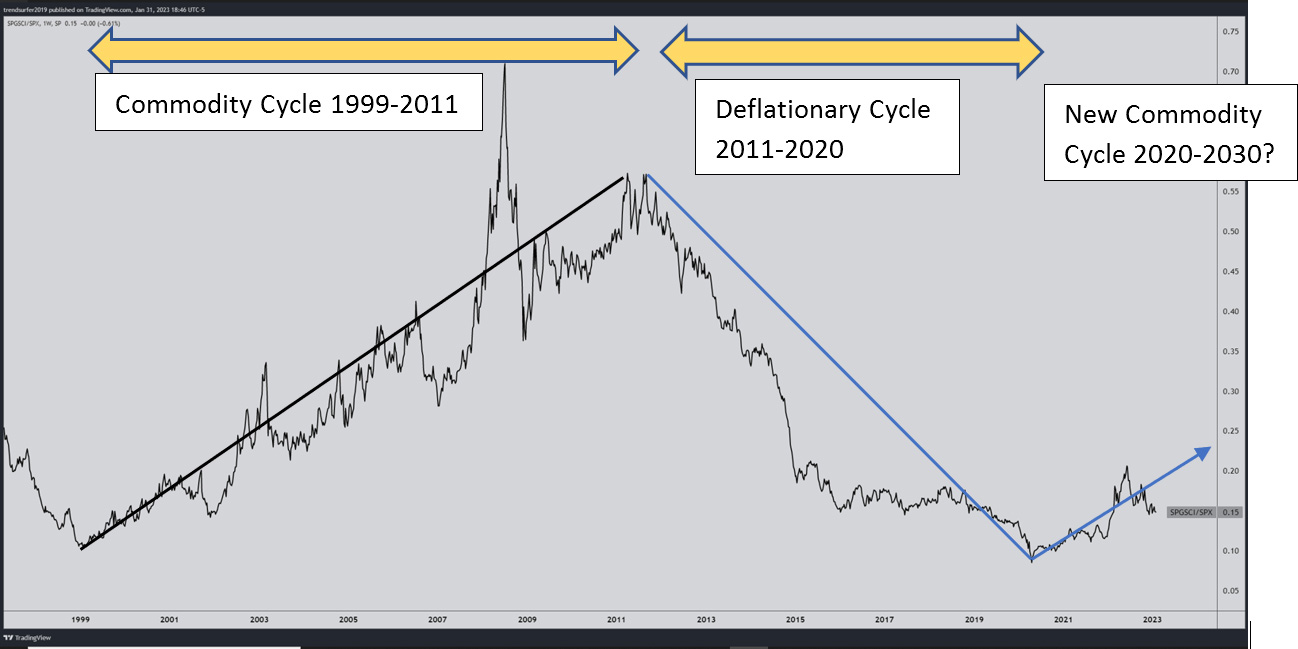
The chart below shows the ratio of the Commodity Research Bureau Index “CRB” to the S&P 500. When the ratio is rising, the market is in an inflationary commodity cycle. When the CRB/S&P ratio is declining we are in a deflationary environment. We believe we are now in an inflationary commodity cycle that began in 2020. These commodity cycles can lead to 700-900% outperformance of commodities over stocks. Consequently, owning commodity stocks could create significant alpha. This viewpoint is also shared by Goldman’s Jeffrey Currie who believes we are in a commodity “super cycle”.
We think commodities will continue to rally for another six to nine years based on historic trend durations. For commodities to lose their pricing power, a new capital cycle in energy and minerals will need to occur. A commodity cycle ends when so much new production is constructed that supply exceeds demand which leads to a prolonged decline in the price of the commodity. The cycle ends with bankruptcies from overcapacity and a commodity price at which production is unprofitable.
The Industry Capex Life Cycle
A capital cycle for gold and gold mining is just beginning. Gold prices are rising and a contraction in gold mining will only reverse when there is an oversupply of gold relative to gold demand. To create new production capacity for a commodity, the commodity price must rise so much that risk capital will fund new mining or drilling projects which cost in the billions. Based on the 1999 to 2011 period, we think gold could experience a multiyear bull market based on a weakening dollar, global central bank gold purchases, the gold capital cycle, and historically low valuations of gold stocks. According to Rudi Fronk, CEO of Seabridge Gold, Inc. (SA), the World Gold Council just released that “global central banks purchased more gold than they have in 55 years. They bought 800 million tons of gold – 400 million tons in q3 and 417 million tons in q4 of 2022”. Fronk also commented that gold equity prices, relative to the gold price, are at their cheapest that he has seen in his career.
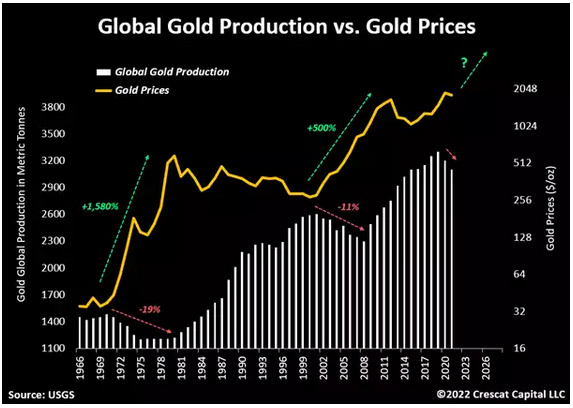
The chart below shows that gold production has been declining and gold appears ready to break out. Global uncertainty, ballooning deficits, the Federal Reserve slowing its tightening cycle, and a topping dollar should drive gold prices higher.
Mining and the Transition:
The climate transition is considered a generational opportunity on the order of 90 trillion dollars. The transition is generally defined by the United Nations Sustainability goals led by ending poverty and hunger but also creating clean water, affordable clean energy, sustainable agriculture and pollution prevention. To build a decarbonized green energy infrastructure and achieve these other transformative goals, there is enormous demand for copper, lithium, nickel, zinc, cobalt… aka “green” or environmentally critical metals. We believe a capital cycle in the mining and minerals essential to building this global energy infrastructure will drive a massive mining capex cycle. The energy transition should lead to lower greenhouse gas (GHG) emissions that destroy the ozone layer causing global warming.
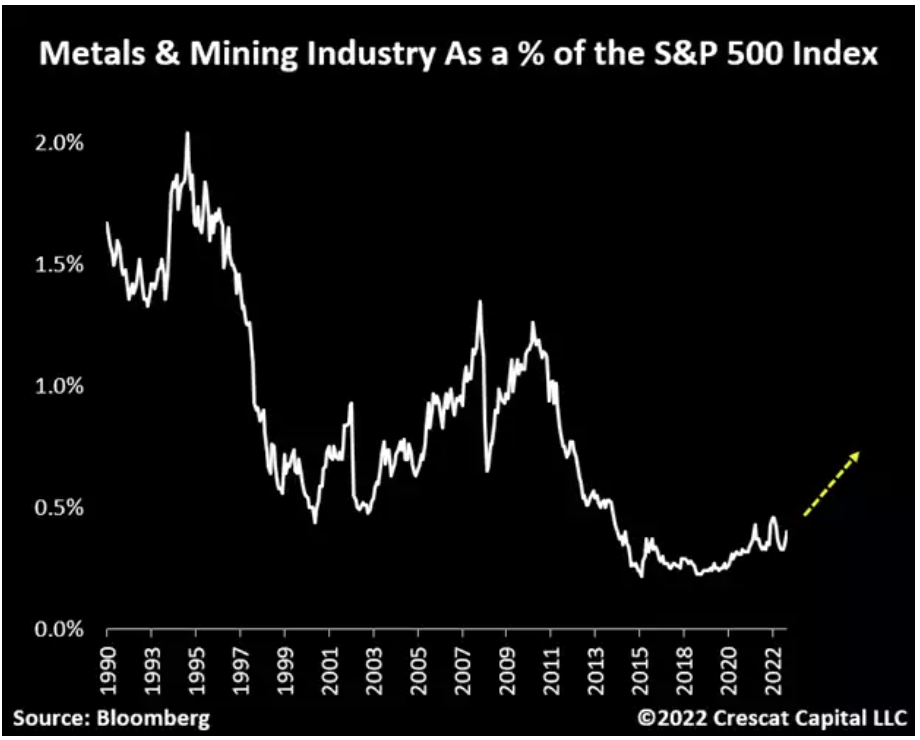
The chart below shows the metals and mining sector today is about one tenth of the share of the S&P 500 in 1999. We believe a metals and mining capital cycle is just beginning and a transition driven mean reversion could lead to a ten-fold return in the decades ahead. This metals and mining S&P share mean reversion mirrors the oil sector’s representation in the S&P 500 index in 2020 which had declined to 3% from 20% and is now on the rebound.
Emerging Markets:
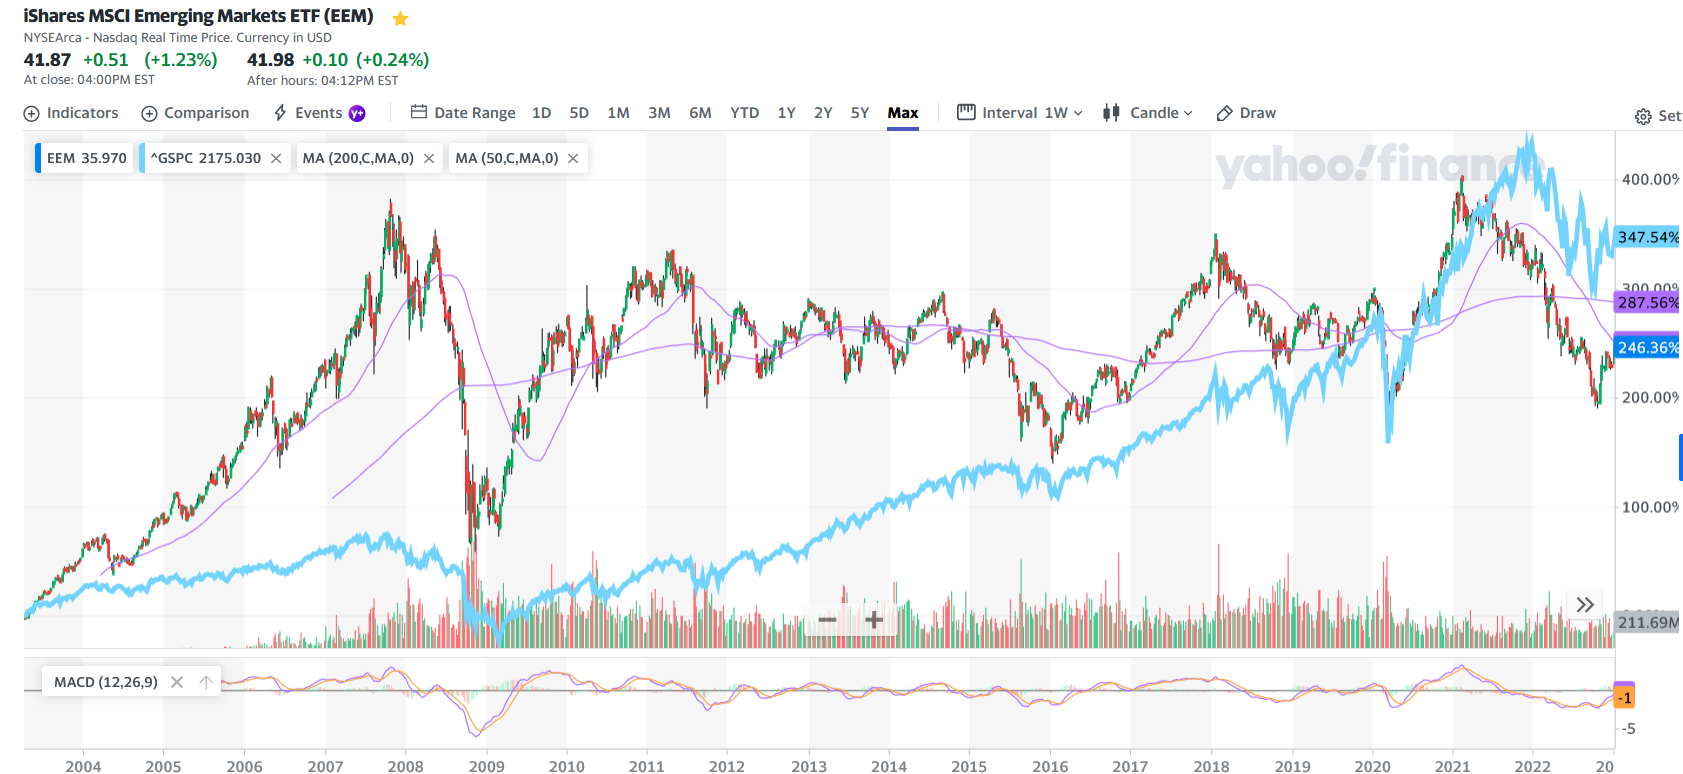
Following the 2000 Technology Bubble, emerging markets rose nearly 400% significantly outperforming the S&P 500 which was basically flat. The chart below shows the MSCI Emerging Markets ETF compared to the S&P 500, since 2003. It is worth noting that in 2001 China was added to the World Trade Organization and the US enjoyed low cost goods produced in China which were sent intermodally via container ships to Walmart’s and other retailers in developed nations. Many emerging markets are mineral rich. India and most South American countries could be positioned for strong growth for the rest of the decade. India and Argentina are particularly interesting.
Conclusion:
Friday’s surprisingly strong employment number shows how difficult forecasting is today. By focusing on longer term trend changes in interest rates, inflation and geopolitics combined with attractive valuation conditions associated with cyclical rotations, we are excited by significant incremental outperformance opportunities available to perspicacious investors. Recency bias and asset allocation inflexibility can risk underperformance to buy and hold investors failing to adjust to new trends and themes in the global market.
Higher interest rates, inflation, changing geopolitics, and shifting industry allocations, suggest to us that precious metals, mining, and sustainability transition trends will be part of the solution to a market environment which offers less compelling prospects for traditional stock and bond investments. Specifically, a 60% equity and 40% bond portfolio, the keystone to attractive risk adjusted returns for the last 40 years, will need to be adjusted. We believe that over-weightings in large capitalization growth indices like the QQQ and S&P 500 should be trimmed in favor of equal weighted indices, value, emerging market, international and small and midcapitalization stocks and this will enhance performance for the balance of the decade.
Successful investing often is momentum investing. Trends continue until they reach valuation extremes when irrational market behavior often occurs. From the early 1980s when Paul Volker chaired the Federal Reserve, inflation neared 15%, and the Fed raised the funds to 20%, the US has enjoyed a near 40 year period of declining interest rates which has enhanced returns on stocks, bonds, and real estate. In late 2020, when global negative interest rate bond ownership peaked near 18 trillion dollars — 20% of all global bonds — a secular change in interest rates, akin to a change in wind direction for a sailor, occurred. Holding fast to tried and true investments and investment strategy is the curse of recency bias. “When the facts change”, as John Maynard Keynes famously said, we change our minds too. We see many exciting opportunities in areas of market such as microcaps, Argentina, nuclear, precious metal, and mining. Right now, is a great time to be open to today’s new facts and new normal.