Silver and gold are reasserting market leadership roles while US equities are priced at historically high valuations. As we enter the historically precarious months of September and October, we are reiterating the rationale of rotating into gold and silver mining, foreign, emerging market, value, and small capitalization equities and reducing US mega cap market exposure.
Katsua Research noted on Friday that the S&P Commodities Index to S&P 500 Index has never been cheaper in 47 years.
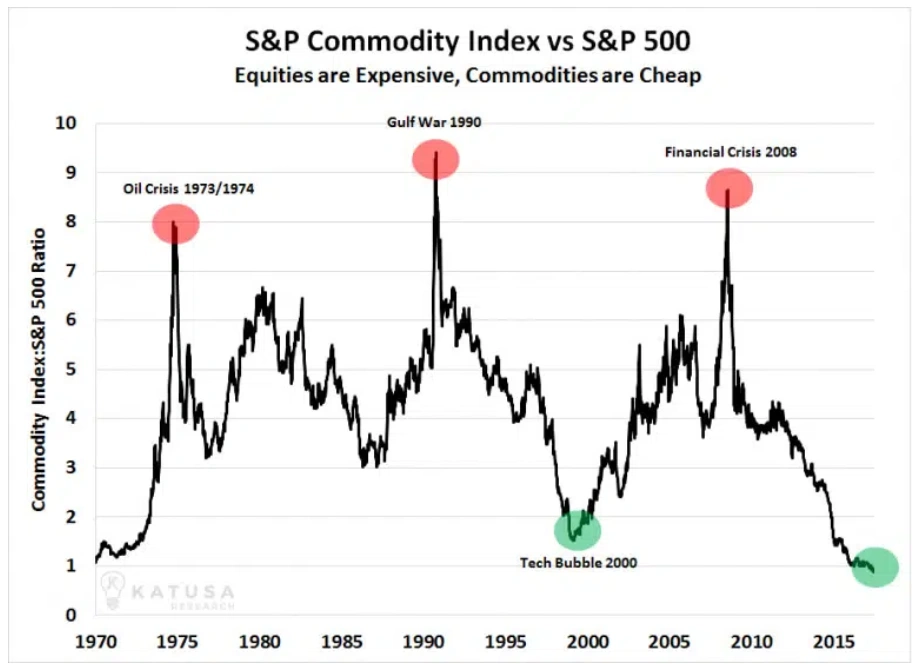
Source: Katusa Research
Our market cycle research and that of Bannister and Forward suggest that commodities and equities are negatively correlated and that their market leadership rotates every 18 years on average. We believe we are entering a new inflationary cycle, and precious metals appear poised to be a source of market leadership for years. The Katusa chart above and the S&P/PPI chart below suggests a trend reversal favoring commodities over the S&P 500 may be a hand.

Source: Longtermtrends.net
During inflationary cycles like the 1970s and the 2000 to 2011 period, the S&P 500 performs poorly, the dollar declines, but international and emerging markets, small cap and value stocks perform well as do commodities and precious metals, in particular.
Our technical and cycle research suggests gold could reach $6500 per ounce in the coming years and silver could exceed $100/ounce. If these precious metals price objectives materialize, then rotating into gold and silver mining stocks could lead to significant equity out performance because miners are undervalued and have tremendous operating leverage.
Our chart analysis below suggests gold will rise to $6500 based on the moves experienced by gold in the two previous troughs to peak inflationary cycles of the 1970s and 2000 to 2011 period.

Source: IGA Research
Applying a similar trough to peak measurement, we forecast a potential rise to $107/oz to $137/oz for silver in the years ahead.
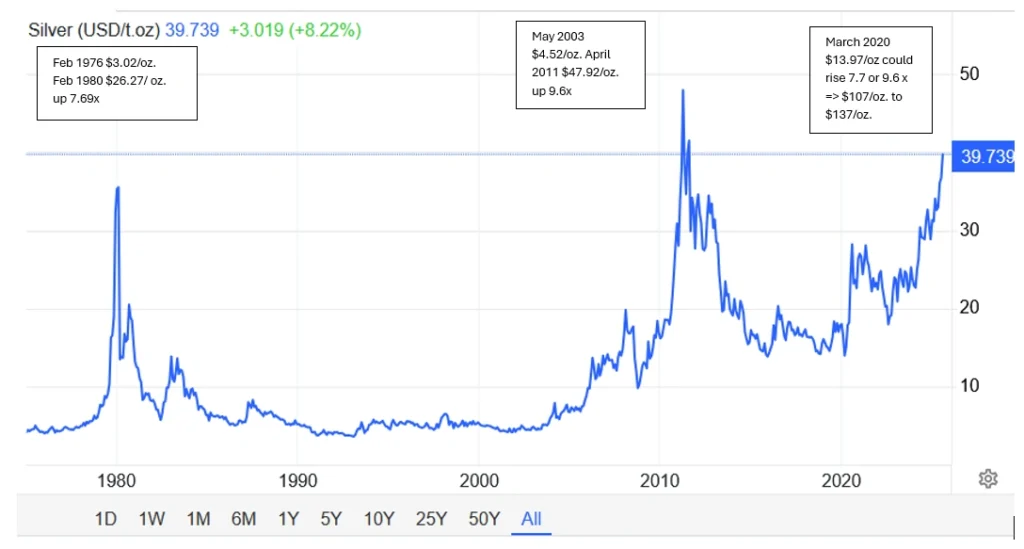
Source: www.Tradingeconomics.com
While gold and silver are correlated, gold is tied more closely to currencies, geopolitics, and safe haven asset appeal than silver. Silver, on the other hand, has more industrial uses and its price is rising as its global demand is exceeding global supply shown below in the chart below from the World Silver Survey 2025.

Source: World Silver Survey 2025 from www.silverinstitute.org
De-dollarization:
Another trend we have observed during these inflationary cycles is dollar weakness. The phenomenon driving a weaker dollar is known as de-dollarization. The BRICS nations Brazil, Russia, India, China, and South Africa seek to systematically weaken the US dollar’s dominance in global trade. Consequently, global central banks have doubled their gold holding since 2015, and this Central Bank buying of gold remains unabated. Central banks are lowering their exposure to dollars and US Treasuries.
The Trump Administration has embarked on a massive program to reshore jobs to the US and reduce the trade deficit through trade negotiations with a liberal dose of trade tariffs. Traders say trade wars become currency wars, and this is likely today under the Trump administration.
We also believe that you cannot solve the problem of too much government debt and deficit spending without currency debasement.
The chart below of the DXY Dollar index shows the dollar was weak during previous inflationary cycles of the 1970s and the 2000-2009 period. The dollar has had its worst first six months performance since the 1970s. The chart below points to periods when the dollar is weak, and these periods coincide with inflationary periods when precious metals are strong, and the S&P 500 is weak.

www.Tradingeconomics.com
Another factor contributing to US dollar weakness is the extraordinary amount of debt the US government has accumulated in the last 25 years. US debt is $37 trillion and 133% of GDP. This amount of debt appears insurmountable. The three major credit rating agencies, S&P, Moody’s and Fitch have all downgraded the US debt’ credit rating, a sign of deteriorating financial strength.

USdebtclock.org
The Case Against the 60 40 Asset Allocation Model:
Since the late 1970s, when the Modern Portfolio Theory rose to prominence, the 60% equity 40% bond asset allocation has been held out as foundational for investors, retirement plans, endowments, and investment advisors for long term risk adjusted returns. We believe this perspective is fundamentally flawed and myopic. Today, the S&P 500 is about four times as expensive it was in the early 1980s when the Modern Portfolio Theory gained popularity. At that time, the CAPE ratio was in the high single digits and 10-year US Treasury yields were as high as 15%, compared to today’s 4.22% yield.
The 45 year valuation swing, since 1980, in stocks and bonds, quadrupled the S&P 500’s CAPE ratio and tripled of the prices of 10-year US Treasuries. This suggests that the 60% equities and 40% bonds allocation is risky, especially if those equities are invested in the S&P 500 and 10-year US Treasury equivalents. We believe a 25% cash, 25% commodities, 25% stocks, and 25% bonds allocation model is more appropriate for retirement plans, pensions, endowments, and retirement aged individuals.
The chart below shows the Shiller’s Cyclically Adjusted PE Ratio since 1880. The CAPE today is higher than during the 1929 peak and 1966 peak. The S&P 500 does not make compelling sense with the CAPE at 37.9, levels consistent with historic market bubbles.

The S&P 500 is expensive on a Market Cap to GDP ratio, aka Buffett’s favorite indicator. The chart below shows the S&P 500 is 69% above average and two standard deviations above its historical trend valuation. This measure too suggests high allocations to the S&P 500 is risky.
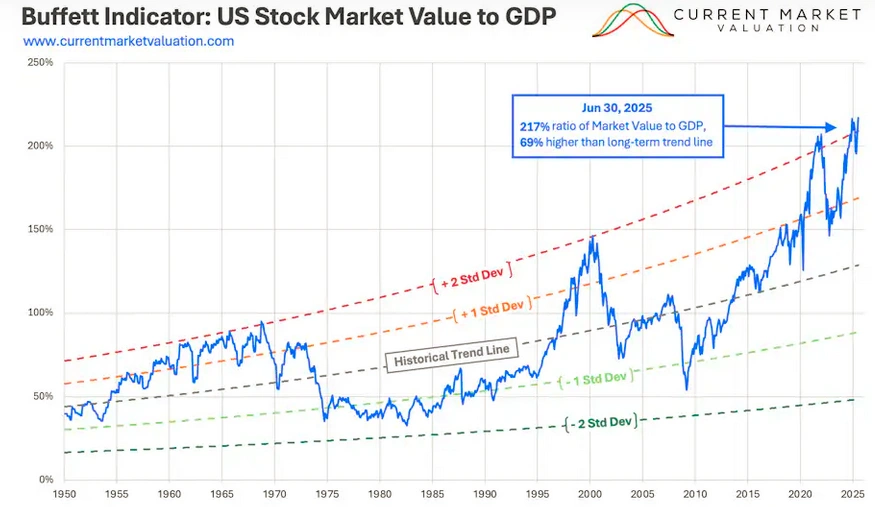
https://currentmarketvaluation.com/models/buffett-indicator.php
The chart below shows 10-year US Treasuries yielding 4.22%, and this yield is unappealing when duration, inflation, and credit risks are incorporated. Furthermore, given the massive decline in rates since the early 1980s, 10-year US Treasury yields do not appear very compelling.

Rotating to Gold, Silver and Precious Metals Miners.
In the absence of strong investment competition from US Treasuries and the S&P 500, it makes sense that gold’s investment appeal is rising. Furthermore, with a weakening dollar, gold’s prospects look stronger as an alternative to the 60/40, the S&P 500 and 10-year US Treasuries.
Beyond the logic of owning gold, the appeal of silver is growing as it historically follows gold higher during precious metals bull markets. Furthermore, silver has numerous industrial uses including electronics and solar panels.
Beyond owning physical gold and silver, there is great investment potential in owning select gold and silver miners which have great operating leverage to the prices of gold and silver. We see solid and potentially extraordinary prospects for gold and silver prices. Since gold and silver peaked in 2011, due to a variety of problems, gold and silver miners have experienced a decade long bear market. Now that the industry has invested heavily in safety and environmentally friendly protocols, shares of gold and silver miners have begun to rally out of long term bases. More importantly, if our metals price targets prove correct, the upside to gold and silver miners is potentially enormous.
If gold rises to $6500/oz. over the coming years and silver rises to over $100/oz., we see material upside for well run precious metals miners.
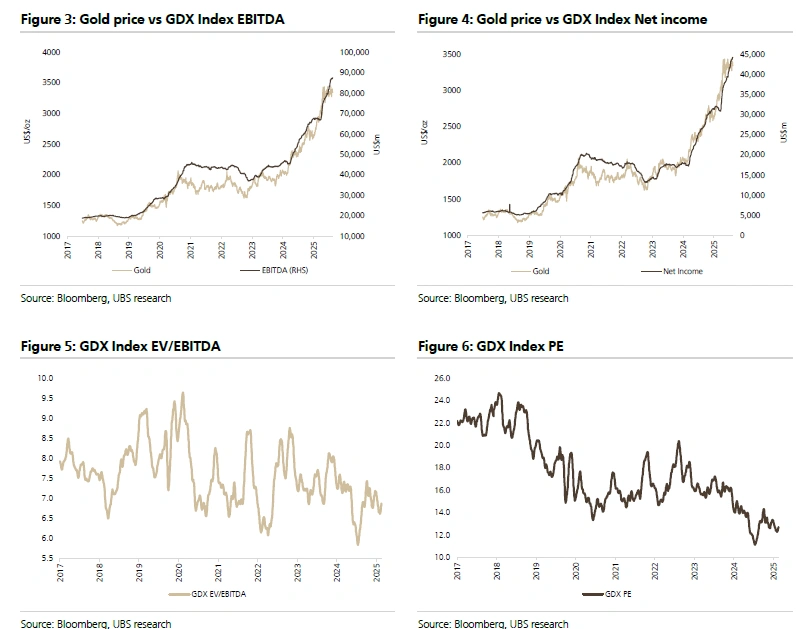
On August 12th UBS wrote a report highlighting the attractive valuation factors supporting our view that gold mining stocks are inexpensive, negatively correlated to the S&P 500, and have significant price upside. Below shows graphically that gold stocks’ cash flows and net income are highly correlated to gold prices. Additionally, the lower two charts show valuations on the gold stock ETF (GDX) are a modest 7 x market cap to cash flow and have experienced a 30% (PE) multiple contraction from 22 to 14 since 2017.
Specific Gold and Silver Equities:
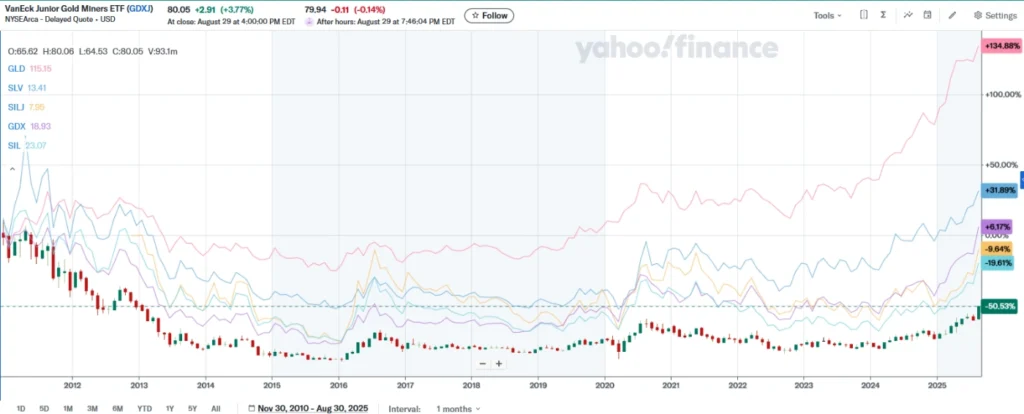
The chart below from December 2010 to the present, shows the price appreciation in gold SPDR Gold Shares (GLD) +134.8%, silver iShares Silver Trust (SLV) 31.8%, the VanEck Gold Miners ETF (GDX) 6.17%, the Amplify Junior Silver Miners (SILJ) -9.6%, Global X Silver Miners ETF (SIL) -19.6, and VanEck Junior Gold Miners (GDXJ) -50.5%.
Since December 2010, the S&P 500 rose 5.16x from 1241 to 6329 or 409%, by comparison.
Beyond the huge performance disparity between the S&P 500, we see precious metals outperforming precious metals miners and, starting in 2016, gold and silver prices moved up ahead of the corresponding miners’ ETFs. Only this year has the performance of the gold and silver miners clearly outperformed their respective precious metals price.
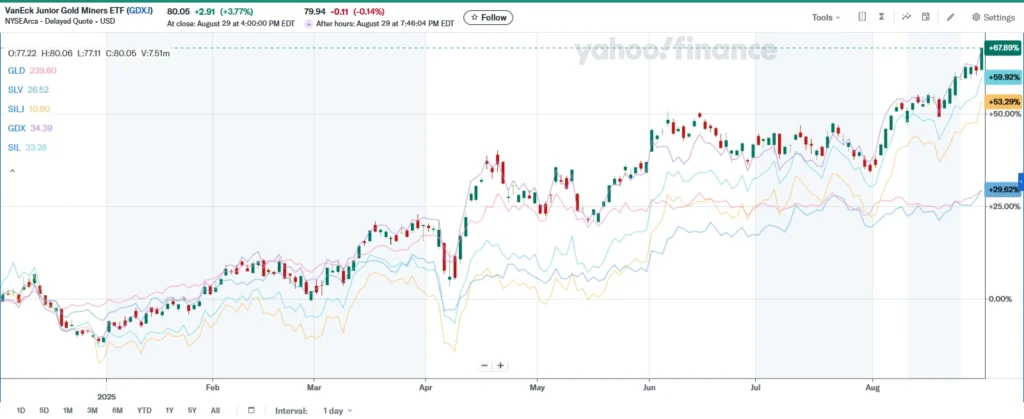
The rise in the price of gold and silver is now driving profitability and improving mining operating performance. Both gold and silver miners, large and small, are now outperforming the metals’ performance year-to-date.
From November 2024 through August 2025, both gold VanEck Gold Miners ETFs (GDX) and VanEck Junior Gold Miners (GDXJ) rose 67%, Silver miners Global X Silver Miners ETF (SIL) rose 58.92%, Amplify Junior Silver Miners (SILJ) rose 53.29%, but gold SPDR Gold Shares (GLD) and silver iShares Silver Trust (SLV) rose 29.6% since November 2024.
We believe that the operating leverage of higher gold and silver prices can drive potentially significant non-correlated alpha to the S&P 500 in the years ahead as higher precious metals prices will drop to the bottom line with modest incremental cost.
Two silver stocks’ earnings and cash flow prospects that appear especially compelling are Coeur Mining, Inc. (CDE) and Pan American Silver (PAAS).

Source: Yahoo.finance.com


Source: Seeking Alpha Financials
The financial table above shows Coeur Mining revenues doubling from 2017; however, the gross profit grows from $250 million to $686 million up 174%, and net income to shareholders up from $10 million or $190 million or 19x.
Pan American Silver Corp. (PAAS)
Yahoo.finance.com


Source: Seeking Alpha Financials
From 2015, Pan American Silver’s revenues rose from $674 million to $3,116 million up (+362%), while operating income rose from ($175 million) rose to $723 million. The varied cash flow measures EBIT, EBITA, and EBITDA all show good growth over the last 10 years. However, if silver continues to trend higher, we expect the operating leverage to drive rapid earnings growth and higher stock prices.
Since gold miners peaked in December 2010, the chart below of gold (GLD) and the VanEck Junior Gold Miners ETF (GDXJ) shows gold miners are down 50% despite gold rising 134%. It seems logical that if we are in an inflationary or commodity cycle and that gold prices double and gold miners could rise multiples and outperform gold at this cycle’s peak in the future.

Conclusion:
As we head into the historically precarious months of September, we again advise our readers and clients to diversify away from US mega caps and capitalization weighted indices and invest in gold and silver mining, foreign, emerging market, value, and small capitalization equities.
We believe that we have entered an inflationary cycle where, like the 1970s and the 2000 to 2011 period, the S&P 500 and the US dollar perform poorly, but during those periods gold rose 515% from trough to peak on average, and outperformed the S&P 500 spectacularly. We believe that compelling non-correlated outperformance to the S&P 500 can be found in gold and silver mining stocks. Both gold and silver appear to be in emerging bull markets.
While we advocate diversification into small cap and value, international and emerging markets for noncorrelated equity exposure, the potential for significantly higher gold and silver prices combined with their great operating leverage suggests tremendous upside for select gold and silver miners. Not only will prospective gains in gold and silver prices drop to the bottom line, they should do so with modest incremental cost, creating operating leverage.
A quick review of the revenue growth and operating earnings since 2015 for Coeur Mining Inc. and Pan American Silver Corp. demonstrate their substantial operating leverage if precious metals prices rise over the coming years.
Given that the VanEck Junior Gold Miners ETF is down 50% from its cycle high in 2010 and there is good upside for gold and silver, we believe select gold and silver miners has material upside. Furthermore, there is a good argument to be made that these precious metals miner shares will do well during an S&P down market as commodities and precious metals are negatively correlated to the S&P 500.
We don’t know if the S&P will go down or revert to the mean or if our targets for gold and silver will prove to be close to accurate; however, the valuations for gold and silver miners are attractive, the prospects for higher metals prices are good, and the broad equity market and S&P 500 is historically near peak valuations and risky. Consequently, selling mega caps to buy gold and silver mining stocks given their valuation disparities and inverse market correlations looks like a prudent allocation to us.