Historically, when the Federal Reserve raises the Fed Funds Rate ten times or 5% in fifteen months, economic growth slows, GDP turns negative, unemployment rises, consumer spending slows, and inflation declines due to reduced demand. That has not happened in this cycle. The Federal Reserve’s hope to return inflation to 2%, is being made more difficult by the banking crisis, grim commercial real estate market prospects, problematic geopolitics, and a federal government that keeps spending money it doesn’t have.
Investors should focus more on “return of their money than return on their money”, as depression era comedian Will Rogers once quipped.
We are currently on the back end of bubbles in stocks, bonds, and real estate that are three-standard deviation above their long term trends. It will take years to unwind these bubbles. Four decades of declining rates created cost savings, multiple expansion, and a virtuous circle or feedback loop which drove stocks, bonds, and real estate to bubble valuations. That declining interest rate environment is now a head wind, and recency bias will keep investors in old winners and old strategies because they have not studied history or experienced challenging environments like today’s. Consequently, this letter will highlight a few themes that should help investors in the years ahead. There will be many opportunities, but we view the current investment environment as one that resembles the 1999 -2010 post tech bubble period and the investment environment of the 1970s.
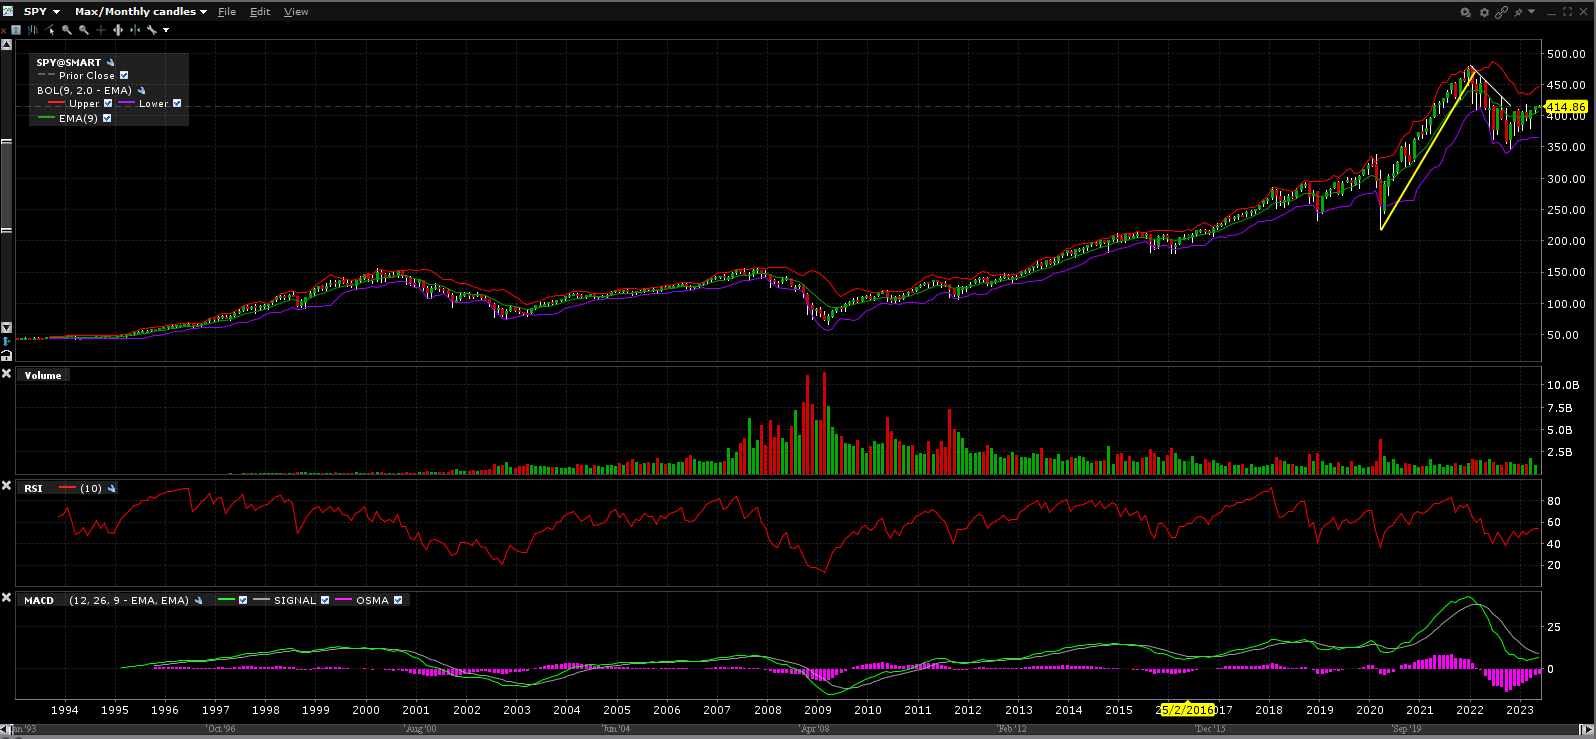
The chart below shows a tremendous move in the S&P 500 from 1990. While we are not arguing a major crash is imminent, we believe the S&P 500 will more likely revert to more normal valuation levels, and for that reason a defensive investment strategy emphasizing higher yielding equities and commodity investments is preferable to a growth strategy for one’s investment portfolio. Recent decades have favored 60% equities and 40% bonds as the preferred allocation for retirement plans and financial planning. Furthermore, the 60% equity allocation has typically favored high growth low dividend indexes like the S&P 500 and the NASDAQ 100 Index. We expect the 2020s environment to have higher inflation and interest rates and recommend a 25% commodity, 25% money market, 25% stock, and 25% bond allocation to retirement portfolios. Additionally, the 60% equity allocation has typically favored high growth low dividend indexes like the S&P 500 and the NASDAQ 100 Index. Additionally, we are supplementing equity allocations with higher yielding investments which offer attractive income that, for retirees, can produce income sufficient to meet living expenses. This avoids counting on future growth and multiple expansion that defined the last four decade’s equity bull market which was enabled by a historic decline in interest rates.
The chart below shows the nearly ten-fold increase in the S&P 500 from 1993 to 2023. We anticipate a reversion to the mean and a period of consolidation — like the post 2000 bubble and post 2008 bubble periods – is probable. Consequently, we want to deemphasize high growth and long duration investments in the years ahead.
Equity Market Risk:
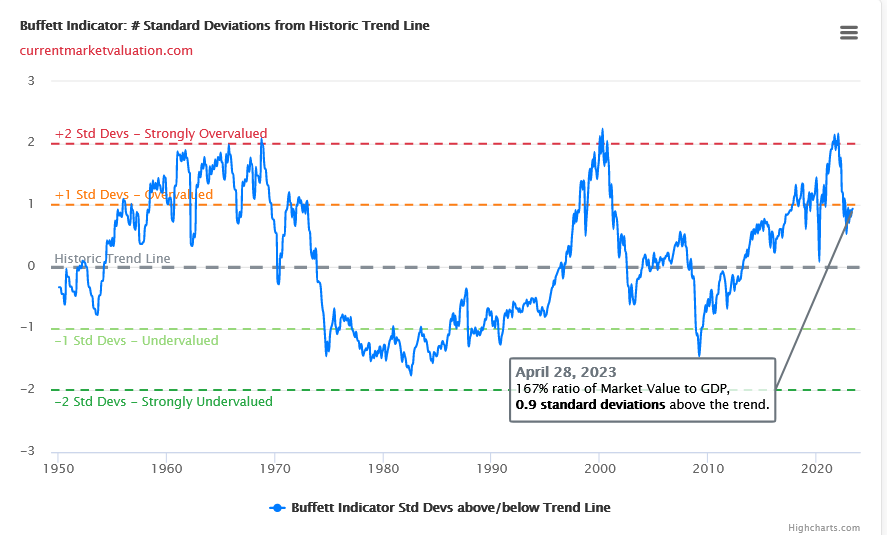
The “Buffett Indicator” provides another example of the equity market risk. The Buffett Indicator compares the equity market valuation of the Wilshire 5000 (the “paper value” of economy) to the Gross Domestic Product “GDP” or real economy’s size or value. The chart below shows how the equity capitalization of the Wilshire 5000 today is 167% of the GDP or 0.9 standard deviations above normal. This valuation metric shows that stocks are overvalued and long term prospects for stocks are lackluster and not the generationally compelling values that they were in 1982 or 2009.
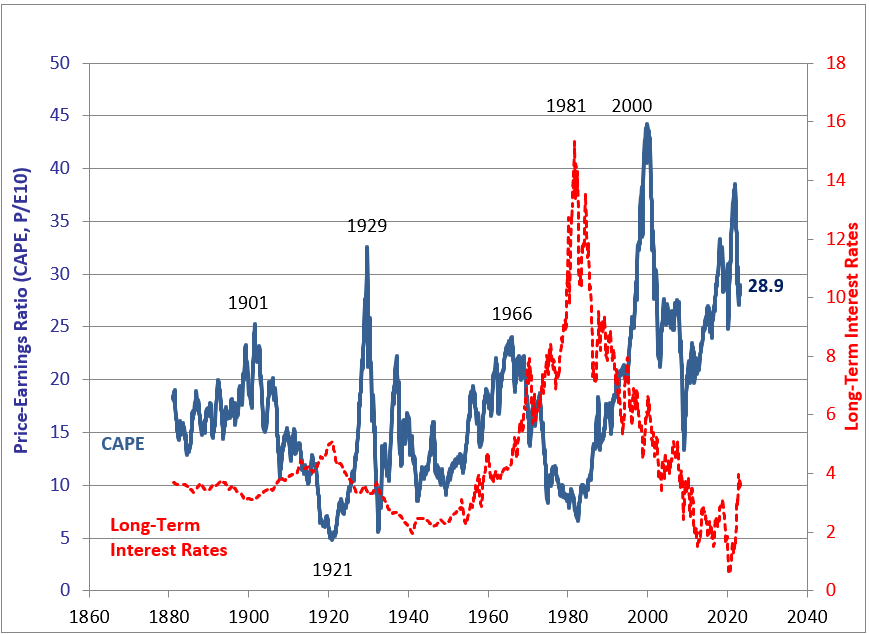
Based on Shiller’s Cyclically Adjusted PE “CAPE” ratio, stocks are overvalued, and the S&P 500 could decline 30 – 50% over the coming years. The S&P 500 could revert to the mean either through a severe decline or, more likely, a multi-year consolidation. Either way, reducing market beta and increasing dividend yield is a prudent portfolio derisking strategy.
The chart below shows the CAPE at 28.9. The 1966 peak to trough decline in the CAPE was from 23 to 7 or 75% and the 2000 peak to trough was 43 to 13 or 70%. It is not unreasonable to think that a decline in the CAPE from its recent PE peak of 38 to 19 or 50% would be excessively bearish. From 28.9 to 19 is a 35% decline. It is not hard to envision a world at war where “happy days” multiples revert to historically average levels. Russia has invaded Ukraine, and peace does not look imminent. China’s imperial threat to Taiwan and other neighbors is problematic. The unfolding conflict in the Sudan and the banking crisis, which commenced with the collapse of Silicon Valley Bank, illustrate the fragility of post bull markets’ underlying assumptions. Continued unexpected risks like these can weigh on equity market multiples.
The S&P 500 is the most over-weighted stock in portfolios today and we believe it could be subject to material downside risk. Dean LeBaron, the index and quantitative pioneer mentioned shorting the S&P 500 for this reason a few years ago when I had the pleasure of meeting him. Today that short is particularly timely for aggressive investors.
Bond Risk Assessment:
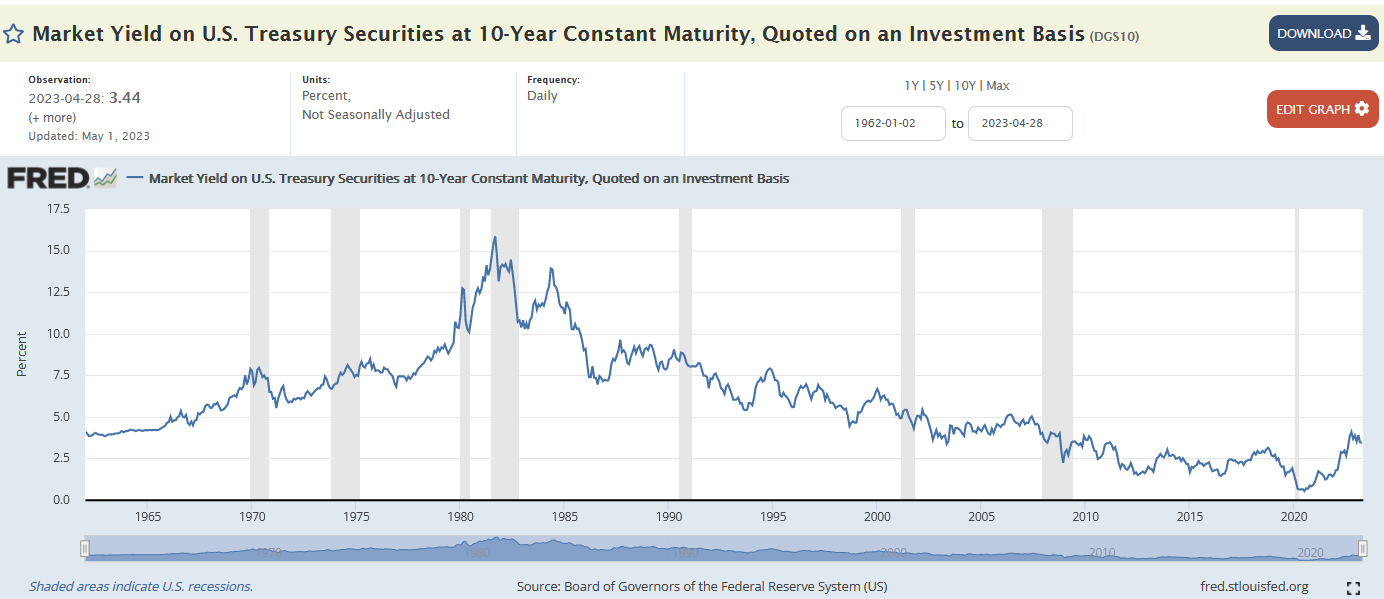
The chart below of the yield on the 10-year Constant US Treasury Note show the decline from 15.2% in August 1982 until 0.50% in August of 2021. We expect yields to remain elevated and not return to the artificially historically low yields of the last decade.
Real Estate Risk:
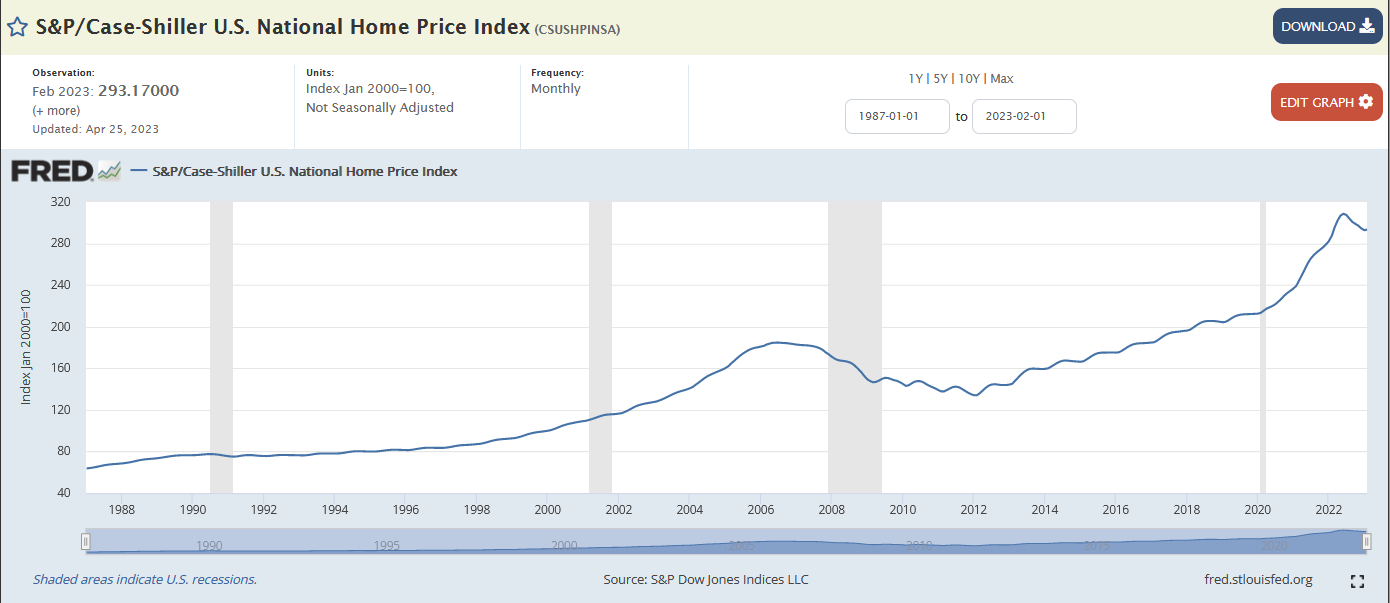
The chart below shows a five-fold move in real estate since 1987, and the 27% decline in home prices from 2006 until 2012. We estimate a 20% decline in residential home prices could occur over the coming years, based on a reversion to the longer term uptrend.
Alternative Investments:
One area where we see potential growth is in the commodity sector. Many basic commodities have pulled back in price and their supply demand economics reflect capacity constraint after years of under investment. Depressed capital expenditures are evident in mining and minerals such as gold, copper, and green minerals. Green minerals are critical to building the green energy transition infrastructure of the future. Optimistic energy transition policies and unrealistic hopes, in part due to ESG exuberance, has left hydrocarbon production capacity insufficient to meet the world’s energy needs. We own and advocate investing in low carbon alternatives like natural gas and nuclear to drive the transition. Natural gas today can provide clean energy and address the existential UN Sustainable Development Goals numbers 1 and 2: No Poverty and End Hunger.
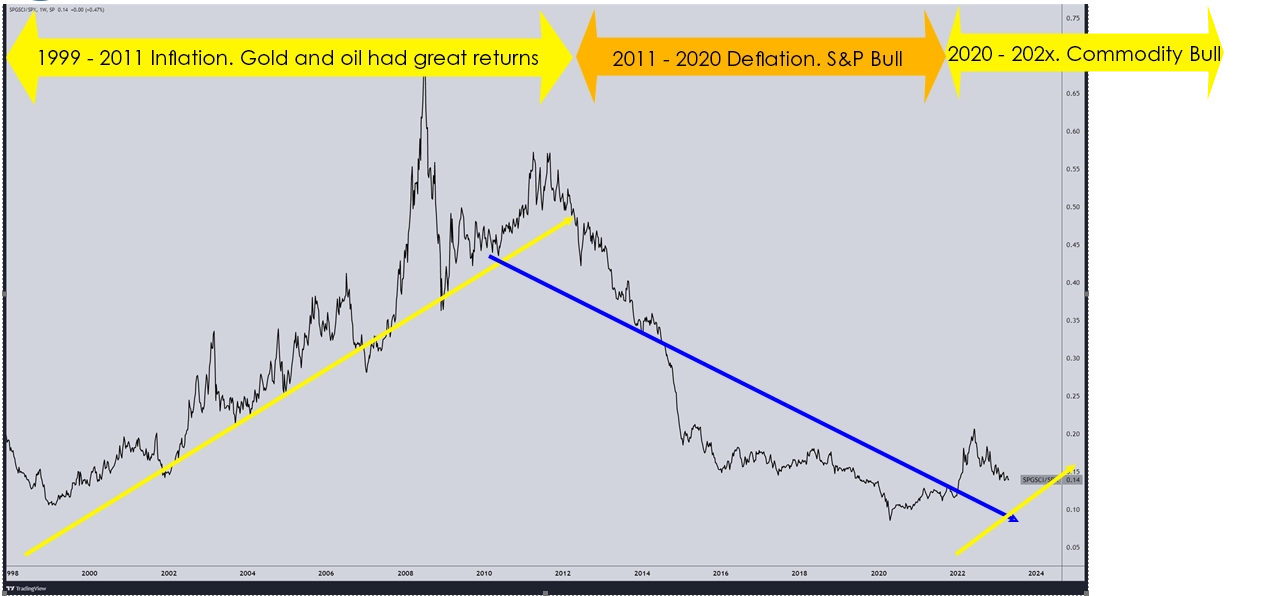
The chart below is of the CRB Index to S&P 500 ratio. The observation we highlight is that we are now in a period, like the 1970s and the 1999 to 2010 period, when commodity prices significantly outperformed the S&P 500. DoubleLine guru Jeffrey Gundlach noted a few years ago how during these commodity periods commodity investments can result in 700 to 900% outperformance over the course of a decade. Since larger capitalization growth equities offer lower return prospects, we recommend owning commodities or commodity correlated equities where we see potential outperformance and portfolio diversification benefits.
The chart below helps to delineate when outperformance rotates from stocks to commodities. When the CRB/SPX ratio is rising, we are in a commodity market. The ratio bottomed out in 2020 and, over the last year, pulled back sharply. We now expect the ratio will begin to turn up and commodities stocks will outperform the S&P 500.
Energy Investments:
We believe the energy transition is a major theme over the next few decades. Hydrocarbons will do well, but so will green minerals needed to build energy transition infrastructure. Copper, cobalt, nickel, lithium, are critical for green infrastructure. We like inexpensive high yielding companies like Antero Midstream Corporation (AM 8.36%), and MLPs like Enterprise Products Partners LP (EPD 7.45%), Energy Transfer LP (ET 9.55%), Magellan Midstream Partners LP (MMP 7.5%) and MPLX LP (MPLX 8.86%). They are smart conservative ways to own high dividends and have energy exposure.
Gold Investments:
Within the commodity space, gold stands out because it historically has been a form of currency and is being aggressively bought by central bank for their balance sheets. Gold is being bought by the Peoples Bank of China. In the second half of 2022, “global central banks purchased more gold than they have in 55 years. They bought 800 tons of gold – 400 tons in q3 and 417 tons in q4 of 2022” according to The World Gold Council.
Gold can provide a range of investment objectives for portfolios. For pure performance, we like owning gold shares rather than the physical metal and prefer the GDX gold Miners ETF to get broad exposure to gold miners. You can own the commodity or coins, but we prefer the securities for the ease of investing. GLD will give you an ETF that buys gold and that is a convenient liquid way to get exposure to this precious metal.
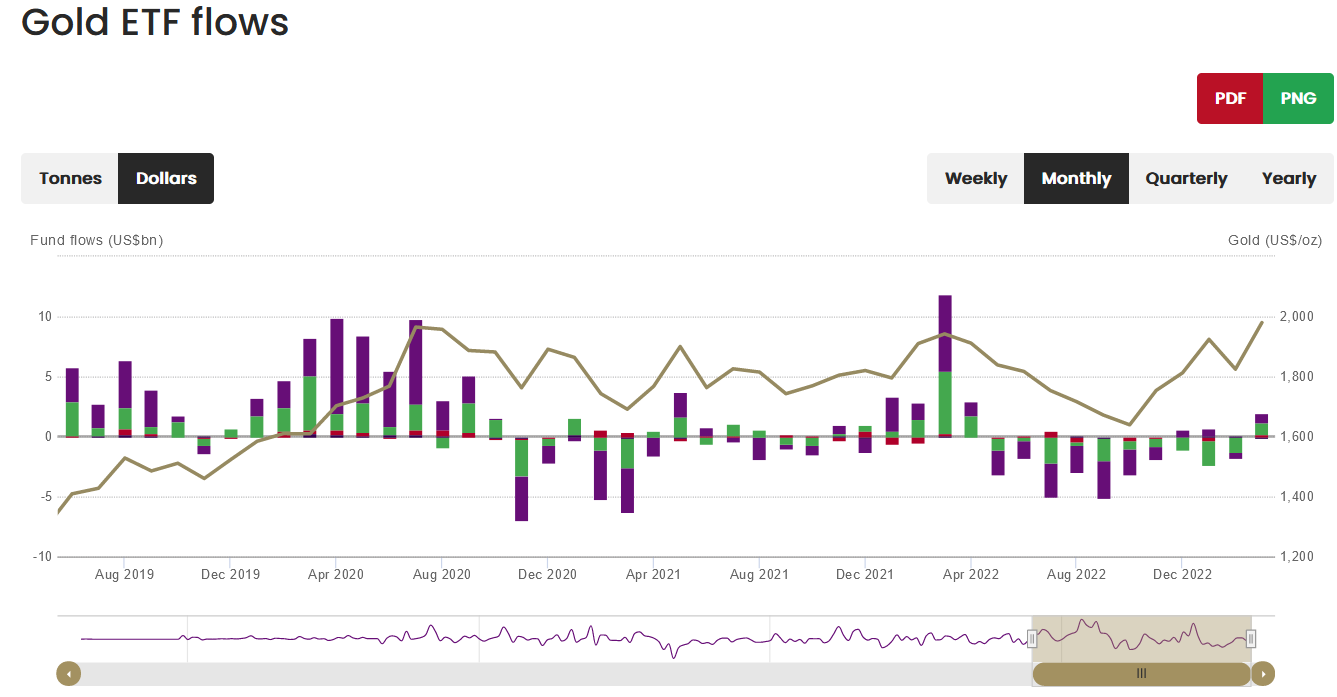
The chart below shows that gold ETF inflows are rising with the price of gold. The current period looks similar to the 2019-2020 period. We wrote letters recommending buying gold and precious metals in September 2019 and another letter to sell them in August 2020. Just like stocks, gold has rallies and pullbacks. We believe we are in the early stages of a major move and gold could rise past 2000 and go to 2400, but higher potential peaks like 3000, 4000, and 5000 per ounce could be highs for the precious metal over the next decade if global circumstances and economic conditions are deeply problematic. Gold will probably run out of momentum after a parabolic rise and after stocks, bonds, and real estate are broadly debunked as steady wealth creation assets.
Crescat Capital, a top firm specializing in gold noted the following compelling fundamentals and commentary for gold stocks:
- “Companies generating near-historic levels of cash flow
- Miners buying back stocks near-record levels at historically cheap valuations
- Highest dividend yields in history
- Highest cash levels in decades
- Lowest P/E ratio for the metals and mining industry since 2008
- Lack of new high-grade precious metals discoveries
- The mining industry as a percentage weight in the S&P 500 Index near all-time lows
- The growth-to-value transition likely to favor highly profitable, low valuation, and counter-cyclical growth businesses such as gold and silver miners today
- Investors increasingly considering gold as the quintessential offensive asset to counterbalance their falling traditional 60/40 stock and bond portfolio
- Most portfolios remain severely under allocated toward metals, especially gold
- Central banks being forced to buy gold to improve the quality of their international reserves
- Precious metals’ prices relative to money supply is near all-time lows”
Crescat Capital’s descriptive list is emblematic of a major bottom for an investment sector. With the gold now prepared to move higher, we are adding gold investments to our portfolios. Gold can be incorporated into a portfolio through a variety of ways that improve investors’ investment objectives in the future. Eg. Total return, income, diversification, noncorrelation, inflation protection, safety…. Can all be provided through gold investments in some form.
For income, we like the Gamco Global Gold, Natural Resource & Income Trust (GGN) which yields 9.68%.
Conclusion:
We are in a confusing economic environment. Inflation is not reverting back to 2% as we predicted and the economy is losing strength. America’s years as the global economic and geopolitical juggernaut it has been since World War Two are looking less assured. Recent inflation, the Treasury’s overleveraged balance sheet, and geopolitical risks, present secular challenges argue for a more defensive investment strategy in the years ahead.
For nearly four decades, the 60% stocks and 40% bond asset allocation thrilled its promotors with good risk adjusted returns. Unfortunately, we now think a lower risk strategy with lower equity exposure and lower duration risk is prudent for retirement money. A 25% cash (money market), 25% bond, 25% stock and 25% commodity portfolio should outperform a passive 60/40 portfolio over the next decade.
To mitigate duration risk and provide attractive income, we are buying equities with high dividend yields. Furthermore, focusing on equities linked to the commodity sector provide a cyclical benefit and diversification to your portfolio.
Sincerely,
Tyson Halsey, CFA