Retirement Investors’ Answer to the 60-40 Portfolio.
The investment environment of the 2020s will be the flipside of the last 15 years’ negative interest rates and quite the opposite of the broad domestic investment experience since 1981 when 10-year US Treasury yields peaked at 15.32%. Since 1981, stocks, bonds and real estate all benefited from the rising tide of valuation expansion with nearly 40 years of declining inflation and interest rates. Because both higher inflation and interest rates will define the 2020s investment landscape, this letter will outline a diversified portfolio that will yield about 5% annually. A 5% yielding portfolio should provide $50,000 per year of income on a $1 million portfolio.
As investors grow older, their ability to replace lost capital declines as their earnings’ potential shrinks. Older individuals may cease to be employable, not earn at their peak earnings levels, and may lack the time and longevity to recoup any capital losses or deficient retirement savings, so that having a large allocation to a portfolio which yields material income is critically important to an older investor’s prudent retirement plan. The blessing of today’s higher rates is that there are more options to create a 5% yielding portfolio than when we had near zero interest rates as we did for much of the 20-teens.
In today’s global economy and market condition, we believe the conventional 60-40 portfolio (60% equity 40% bond) favored by many financial planners and investment advisors is both overpriced and nearly obsolete. We believe investors should shift to a 25% cash, 25% commodities, 25% stocks and 25% bond asset allocation and that allocation will be a far more prudent strategy than the popular 60-40 portfolio. Compared to the 60-40, the 25-25-25-25 portfolio yields more, is more inflation hedged, and is more tactically flexible due to its 25% cash allocation which can permit bargain hunting during market downturns and opportunistic rebalancings.
Click on this hyperlink to see our April 25 Market Review with Mitch Bulajic on AI, Richard Gula on Market Vulnerabilities, and investment icon Dean LeBaron attending.
60-40 is Overpriced:
Since 1981 when US Treasury yields peaked at 15.32%, support for an investment allocation strategy known as the “60-40” portfolio has grown in popularity. This popularity was steeped in the Nobel Laureate thinking of Harry Markowitz and William Sharpe. Furthermore, with the digitization of investment management, growth in index investing, and the proliferation of Exchange Traded Funds, creating a 60-40 portfolio with 60% in the S&P 500 (SPY) and 40% in a 10-year US Treasury note ETF like (TLT), became the keystone to portfolio management and just a few keystrokes away from any investor. The 60-40 portfolio has become core to pensions, foundations, retirement plans, and institutional and retail investment management. Like many popular trends, the 60-40 portfolio strategy’s growing popularity has driven the portfolio to an overpriced level where future performance will likely be muted and disappointing.
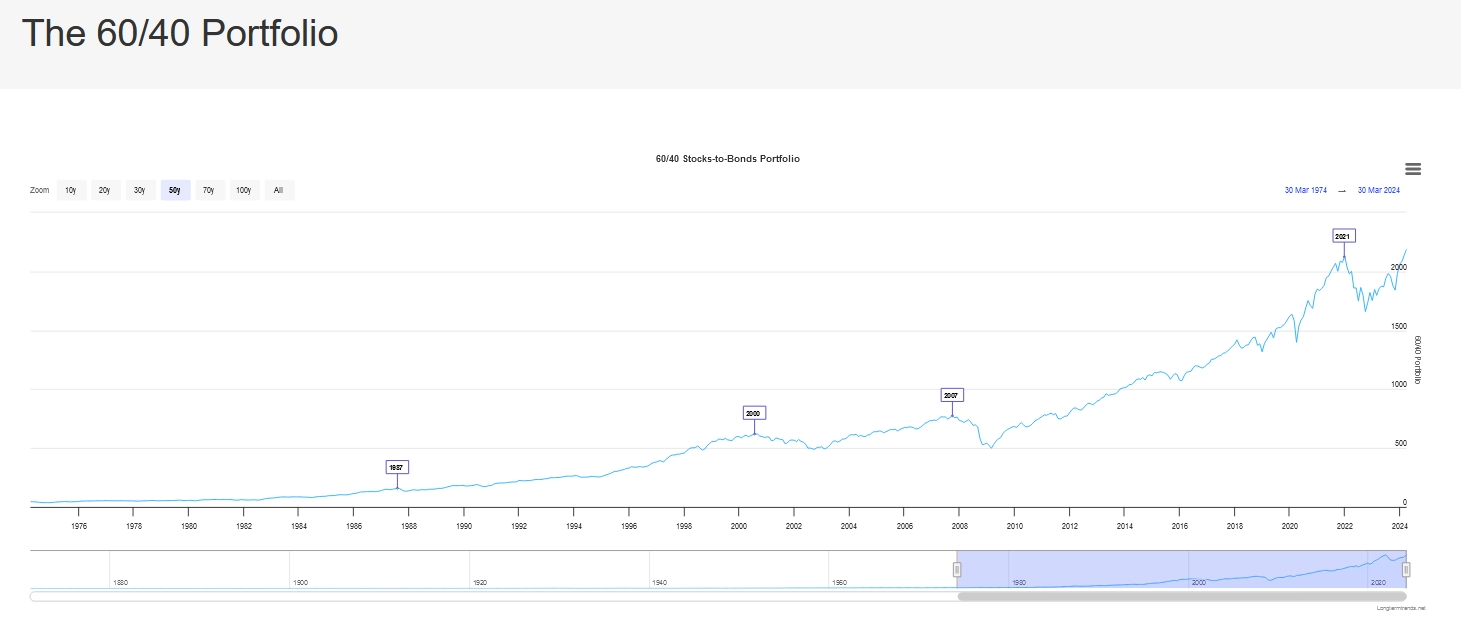
Below is a chart of the performance of the 60-40 portfolio since the 1970s. Its performance has been great. But, since 1981, both stocks and bonds have benefited from declining interest rates, and we do not believe we will have those favorable tailwinds at our backs in the years ahead.
Alternatively, we expect a rotation to new asset allocations and new investment leaders will occur and help a 5% income portfolio for the 2020s to outperform a 60% SPY 40% TLT portfolio in the years ahead.
A quick historical review of October 1981 prices of the S&P 500, its dividend yield, and the yield of the 10-year US Treasury yield, show why a 25% cash, 25% commodities, 25% stock, and 25% bond portfolio is a better risk adjusted asset allocation strategy than the 60-40 portfolio.
September 1981 Market Prices:
S&P 500 118.30
S&P 500 earnings 15.27 ttm
S&P 500 7.74 PE
S&P 500 dividend yield 5.5%
10-year US Treasury yield 15.32%
The prices and valuations above are what truly attractive security prices/values look like.
Below is the stock market data we used from Noble Laureate Robert J. Shiller and available at Yale.edu.
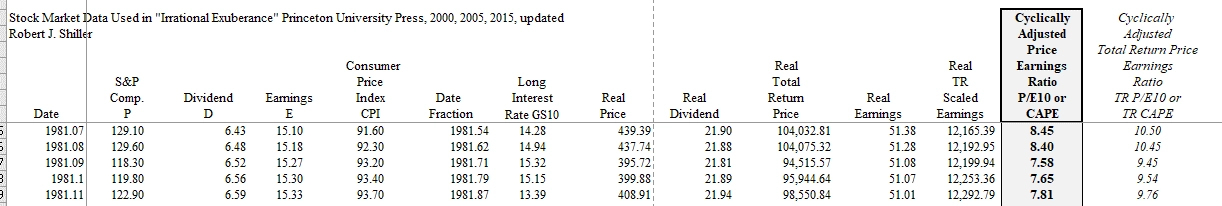
If you managed a $100 billion pension portfolio in September 1981, it would not be hard to invest $60 billion in the S&P 500 at a price earnings (PE) multiple of 7.74 and a dividend yield of 5.5%. Furthermore, investing $40 billion into 10-year US Treasury bonds yielding 15.32% would also be a “no-brainer” as the yield is so high you could easily exceed your actuarial benchmark of 10% calculated for your pensioner mandate while investing in “risk free” US Treasuries.
With the S&P 500 closing at 5035.69 and TTM eps of $192.43 and a dividend of $70.82, today’s S&P 500 PE multiple is 26.26 and has a dividend yield of 1.4%. Today’s S&P 500 value proposition is 3 times more expensive in terms of earnings multiple and a ¼ of the yield that the S&P 500 offered in 1981. Today, the 10-year US Treasury yield is 4.68% and less than 1/3 the 15.32% yield offered in 1981.
The chart below shows the massive rise in performance of the 60-40 portfolio, since the 1980s, and it appears to be topping as it did in 2000 and 2007.
The Inflation Cycle:
We believe that by incorporating inflationary cycle timing, investors can materially improve their investment returns. Since 1887, equities and commodities have cycled through 10-20 year periods as shown in the chart below. Since 1887, markets have rotated through inflationary and deflationary periods and are primarily a function of inflation. During deflationary cycles, stocks soar, as do bonds. During inflationary cycles, commodities like oil and gold outperform.
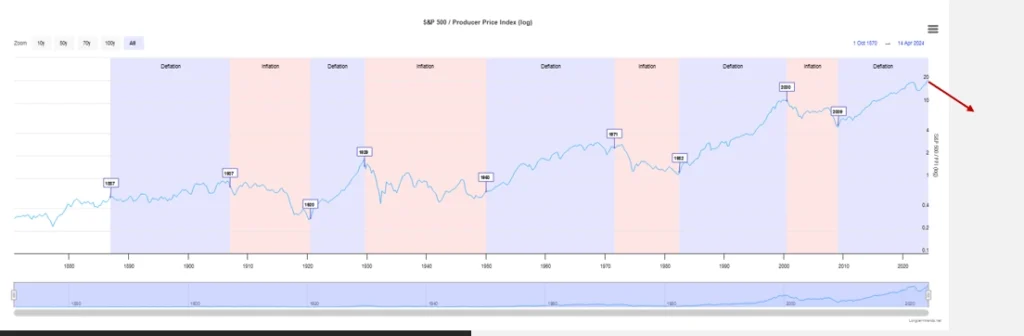
We believe that we are now entering an inflationary cycle and based on the inflationary cycle experience of the 1970s and the 1999-2008 period, commodities like gold and oil are likely to outperform the S&P 500 and the 10-year US Treasury.
Model 25-25-25-25 Portfolio:
Below are names and allocations with which we would build a portfolio.
25% Cash – Money markets today offer nearly 5% yields. Given that interest rates could move higher if the Federal Reserve needs to tighten monetary policy, 25% allocated to money markets seems prudent. Interactive Brokers’ money market yields 4.83% and we keep most of our client accounts there.
A money market has no duration risk, so if interest rates rise, the money market yield will rise but the value of the shares will not decline in value. During the post-Great Financial Crisis period, money markets yielded close to zero. At that time money often moved into riskier assets to provide income for those living on a fixed income. This period of zero interest rate policy was a great disservice to retired individuals as they were forced into longer duration bonds or assets with capital risk in search of better income. Market participants called the period “TINA” for “There Is No Alternative”, because short term interest rates were so low, investors had no choice but to invest in stocks, bonds, or real estate.
While we think of cash as anything with a maturity of less than 90 days, we are comfortable locking into short term US Treasury notes, like the 2-year US Treasury note, especially when its yield exceeds the inflation rate. Today’s 2-year US Treasury note yields 4.96% and the PCE and CPI are around 3%.
25% Commodities:
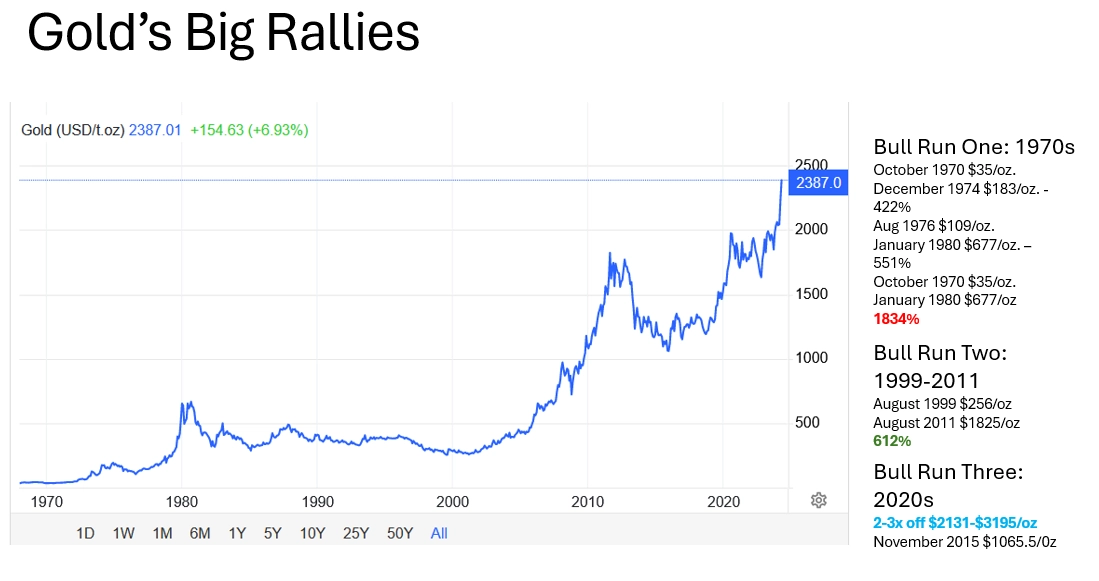
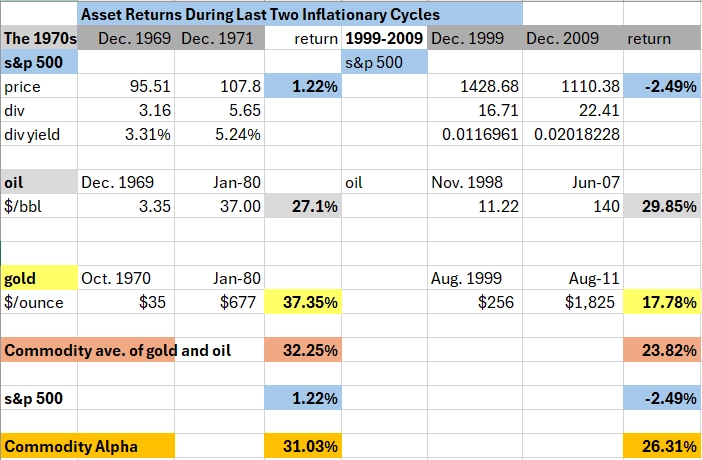
In both the 1970s and the 1999-2008 period inflationary cycles, substantial returns were generated by investing in gold and oil, and commodities generally. Gold rallied from $35/oz. in October of 1970 to $667/oz. in January in 1980, an 1843% return. In the latter period, gold rallied from $256/oz. to $1825/oz. a 612% return. During both periods the S&P 500 performed poorly.
Crude oil, as shown in the chart below, has also had major bull markets during these inflationary periods.
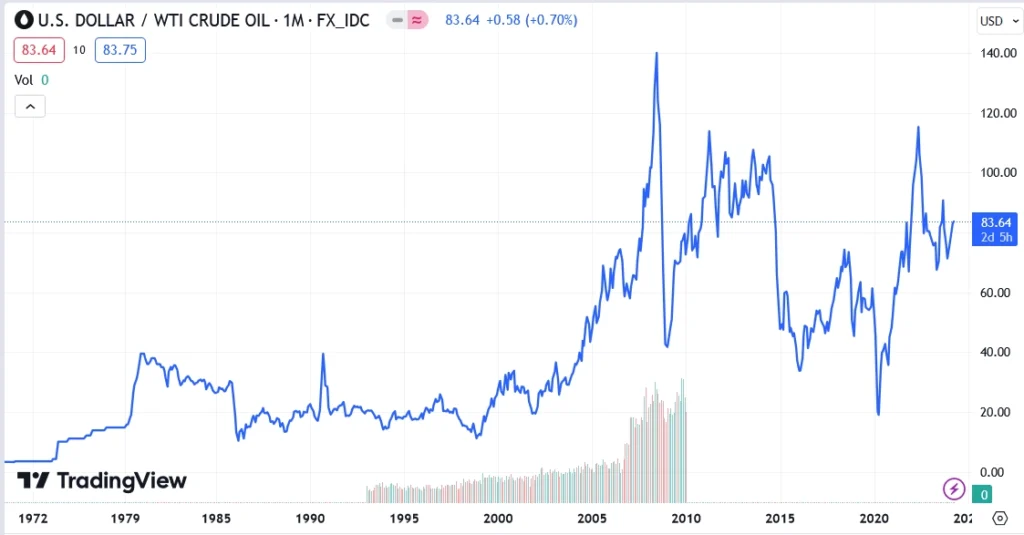
During the 1970s and the 1999-2011 inflation periods, we observed these performances. From December of 1969, when WTI traded at $3.35/bbl, oil rose to $37/bbl in January of 1980. A tenfold move over the decade that substantially outperformed the S&P 500 which went nowhere.
From November of 1998, WTI rose from $11.22/bbl to $140/bbl in June 2008, a twelve fold move, again during an inflationary period like the 1980s.
The table below shows the stunning outperformance of oil and gold compared to the S&P 500 during the most recent inflationary cycles, the 1970s and the 1999-2011periods.
Individual Security Picks:
We are disinclined to recommend any individual security picks at this writing. However, we will highlight some investment options which could be helpful in building the 25-25-25-25 portfolio with a 5% yield.
For gold exposure we like GLD, GDX, GDXJ:
- SPDR Gold Shares (GLD) — an ETF that buys gold bars and seeks to reflect the price of gold bullion.
- VanEck Gold Miners ETF (GDX) – an ETF that invests in common stocks and depository receipts of companies involved in the gold mining industry.
- VanEck Junior Gold Miners ETF (GDXJ) – an ETF that invests in smaller early stage companies which generate at least 50% of their revenues from gold.
For oil exposure, we like XLE and KYN.
- Energy Select Sector SPDR Fund (XLE) – an ETF designed to track the GICS energy index which invests in oil, gas, consumable fuels and energy equipment and services.
- Kayne Anderson Energy Infrastructure Fund, Inc. (KYN) – is a closed end fund investing in North American energy infrastructure sector through investments in traditional midstream, natural gas & LNG infrastructure, utilities, and renewable energy. Its distribution yield is 8.79% and the shares trade at a 14.4% discount to net asset value.
Individual companies and other energy ETF of CEFs can be considered based on your investment objectives and risk tolerances.
Income-Bonds
We like the following income vehicles as they produce attractive yields and are bond alternatives.
- GAMCO Global Gold, Natural Resources & Income Trust (GGN) – is a non-diversified, closed-end management investment company that seeks to provide a high level of current income. It uses covered writing to generate additional income and historically is correlated with gold prices. GGN yields 9.02%.
- Templeton Emerging Markets Income Fund (TEI) – is a closed-ended fixed income mutual fund that invests in the fixed income markets of emerging market countries across the globe. It primarily invests in bonds issued by sovereign or sovereign-related entities and private sector companies. It currently yields 10.86% and seeks to target a 10% distribution yield.
- TELZ is the baby bond obligation of Tellurian Inc. These notes have an 8.25% coupon and trade at $11.49/bond out of $25/bond and have an effective yield of 17.9%. This is a speculative but attractive investment as Tellurian is trading at a 50% discount to book value, and its assets well exceed its liabilities.
Equities:
We want to broaden the equity exposure from the S&P 500 (SPY) and NASDAQ 100 ETF (QQQ) which are large capitalization weighted index ETFs to include international markets and emerging markets as well as small capitalization and value stocks, where greater value can be found. Depending on individual investment objectives and risk tolerances we will not make any particular recommendations in this letter beyond saying the best years for S&P 500 (SPY) and NASDAQ 100 ETF (QQQ) are now in the rear view window, and we broadly want to look for better values that have been out of favor.
Conclusion:
We believe there is significant value to be realized in shifting portfolios away from the 60-40 portfolio and reallocating to a 25% cash, 25% commodities, 25% bond & bond alternative, and 25% stock portfolio in the decade ahead. We believe that the 60-40% portfolio is overvalued and over owned. We also have entered an inflationary cycle where equities tend to be flat and commodities rally. This was especially evident during the 1970s and the 1999-2011 period when the average of gold and oil outperformed the S&P 500 by 31% and 26% annually, respectively.
The benefit of higher inflation and interest rates is that investors can create portfolios with attractive yields such as the 5% portfolio for the 2020s as we have begun to reveal in this letter.
As investors grow older, their ability to replace lost capital declines as their earnings’ potential declines. Older individuals may cease to be employable and may lack the time, energy, and longevity to recoup any capital losses or deficient retirement savings. Consequently, having a large allocation to a portfolio which yields material income is critically important to an older investor’s prudent retirement planning. The blessing of today’s higher rates is there are now more options to create a 5% yielding portfolio than during the 20-teens when stocks kept rising due to TINA “There Is No Alternative”. Today value can be found away from the S&P 500, the QQQ ETF and longer term bond portfolios or ETFs like the TLT.
While we are not forecasting a collapse in stocks or bonds, both asset classes are historically rich. Seeking out undervalued assets and higher yielding assets is a prudent move especially for aging investors. A move away from a 60-40 portfolio to a 25-25-25-25 portfolio is a good first step for today’s inflationary 2020s market environment.