Simultaneously, foreign and emerging market stocks have turned up as did gold and value stocks reflecting a leadership rotation out of overvalued and over owned mega caps and into long dormant geographies and sectors.
Through March 28, the table below shows the negative performance in the S&P 500, Dow Jones Industrial Index and NASDAQ as well as the positive performance in the MCSI EAFE and Emerging Markets, as well as Russell 1000 value indices. After decades of US market leadership and “American Exceptionalism”, we believe we are in a decade long leadership rotation similar to that which followed the 2000 market peak.
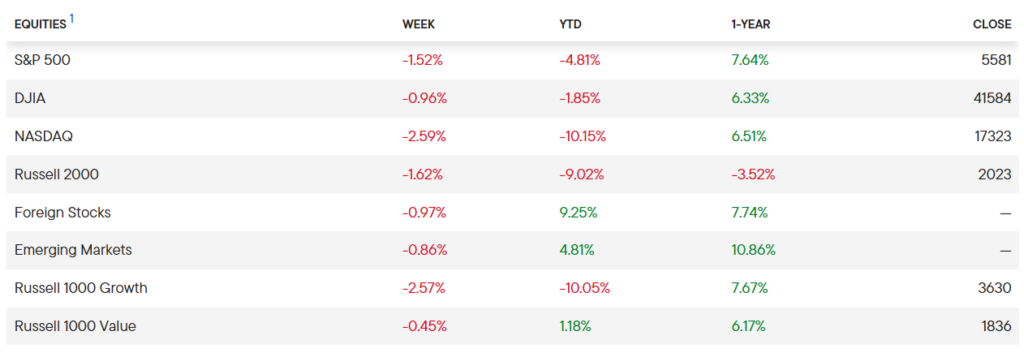
Source: Franklin Templeton
The first quarter experienced unusual uncertainty due to the Administration’s threatened tariff regime. This has paused business momentum but promises to bring manufacturing back to the US following decades of offshoring.
Continued fighting in Gaza and Ukraine also threaten wider wars and additional global economic instability. As the new administration seeks to implement meaningful policy changes in geopolitics, international trade, government efficiency, and safety, markets will likely tread water until policy implementation is clear. During this pause former leaders will lose momentum and new investment leadership should emerge or gain momentum.
Because momentum investing and cycle changes can meaningfully impact investment returns and portfolio strategy, this letter will seek to illuminate these important cycle and momentum changes.
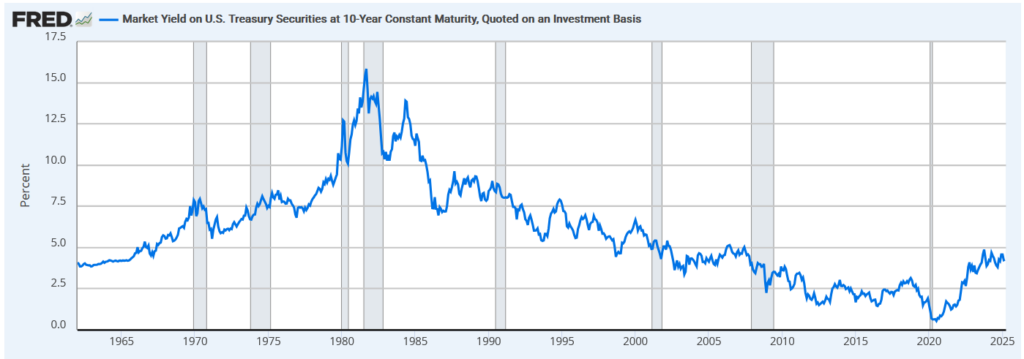
Treasury Yields:
In 2020, 10-year US Treasury yields bottomed at 0.55% down from over 15% in 1981. With the advent of inflation in 2021, a four decade long period of declining interest rates and inflation ended, and an inflationary cycle commenced. This four decade period of declining interest rates helped US equities, bonds and real estate, generate exceptional double digit returns, a phenomenon that gave birth to the concept of “American Exceptionalism”. As stocks, bonds, and real estate stop delivering exceptional returns, we anticipate new sectors, assets, and geographies will become new investment leaders.
The chart of the 10-year US treasury yield below shows a reversal upwards in interest rates in 2020 and that interest rates are close to historically normal levels. Consequently, we anticipate interest rates will remain range bound and are not trending meaningfully lower.
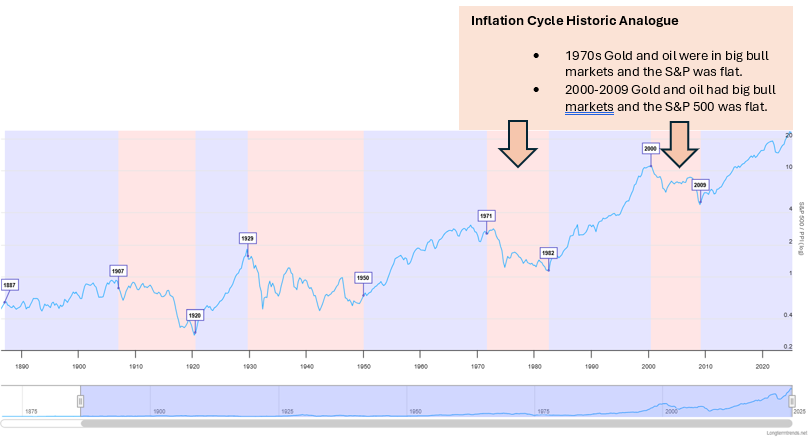
The Inflation Cycle:
The chart below shows inflationary and deflationary cycles since 1887. We believe we are entering an inflationary cycle where the S&P 500 will underperform inflation and commodities. The 1970s and the 2000-2009 period are inflationary cycles and market analogues which highlight potential future leadership in commodities and emerging markets.
The Growth to Value Shift:
During declining interest rate environments long duration assets like growth and technology stocks appreciate disproportionately. That trend has reversed and the ratio of value to growth stocks should favor value stocks for the next several years. The chart below of the MSCI Growth/Value ratio suggests a period of protracted weakness in growth stocks versus value stocks lies ahead.

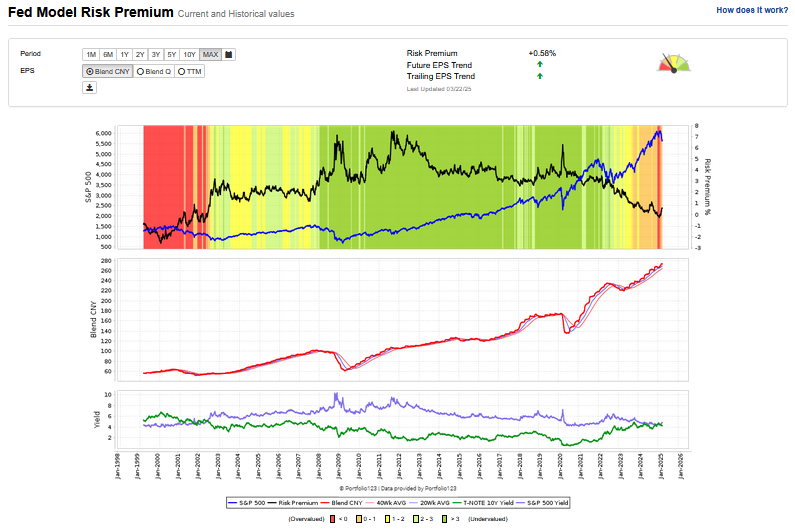
S&P 500 Near Peak Valuations:
The current Fed Risk Premium Model shows the stock market relative to the 10-year US Treasury yield is now in the red zone or below zero which was last experienced during the 2000 Technology market bubble.
A Cautionary Technical Indicator:
During the first quarter, the S&P 500 broke the 200 day moving average. While this break does not mean the market will sharply decline, all major market declines experience the S&P 500 price breaking below its 200 day moving average.

Parabolic Moves and Irrational Exuberance:
Noble Laureate Robert Shiller’s book Irrational Exuberance showed the history of manias being correlated with historic over-valuations, parabolic stock charts, and irrational exuberance. The charts below from Crescat Capital capture the eerily similar parabolic rise of mega cap stocks today to that which was experienced during the 2000 Technology Bubble.

The Case for International Markets:
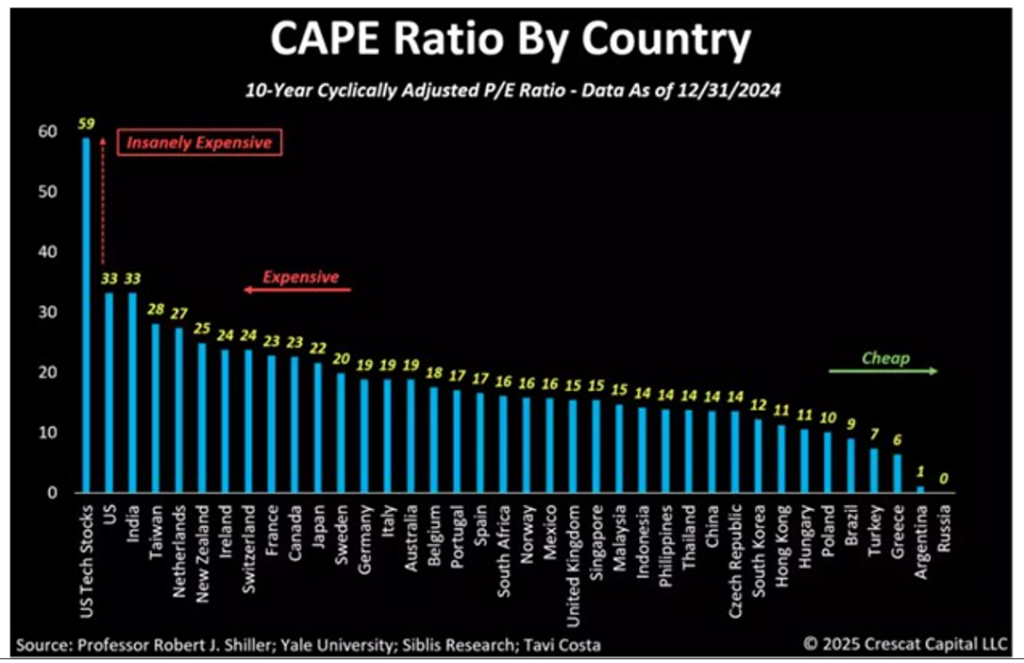
In the aftermath of the 2000 bubble, emerging markets became sources of meaningful equity market outperformance. From 2000 to 2007, the Chinese FXI rose nearly seven fold, which was remarkable outperformance. In the last few years, we have seen India and Argentina produce outsized returns. However, the chart below of CAPE ratios point to where potentially significant outperformance can be found in countries with very low CAPE Ratios. The chart below not only illustrates the extreme valuation risk to the Magnificent 7, India and the US, it also shows some extremely low valuations for Argentina, Brazil, Hong Kong, South Korea, and China. These countries appear to be regions where significant noncorrelated alpha can be captured. With a successful end to the Russian war on Ukraine, significant opportunities could also be found in Europe.
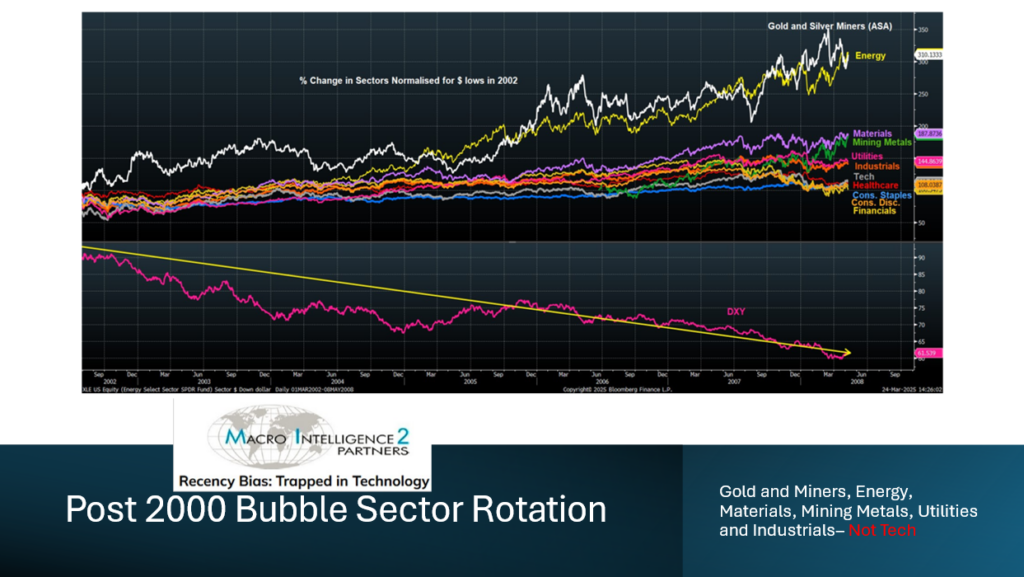
Julian Bridgen of Macro Intelligence Partners 2 charted the protracted period of out performance of the MSCI emerging markets in the wake of the 2000 Technology bubble. We believe this illustrates a valuable historic analogue for where geographical outperformance can be secured in the years ahead.

Likewise, Bridgen also charted sector outperformance in the post 2000 market bubble in the chart below showing leadership in precious metals, energy, materials, mining and industrials. We forecast outperformance in gold, silver and mining shares in the years ahead, but are less optimistic about energy stocks like oil and gas.
In the years ahead, as the US seeks to expand its oil and gas production, lower oil and gas prices will hurt the bottom line of oil and gas producers. Ironically, natural gas and oil producers did especially well during the Biden Administration as it was unfriendly to hydrocarbon development and prices rose helping those producers’ earnings. However, the current administration would like lower oil and gas prices to reduce inflation and improve US consumer purchasing power – which in turn would be an economic headwind for oil and gas producers in the US. Lower oil prices could, however, hurt regimes unfavorable to the US like Russia, Iran, and Venezuela.
The Case for Gold Stocks:
We are especially sanguine about gold and gold stocks. Gold appreciated sharply during the 2000 to 2011 post bubble period from $282/oz to $1823/oz — 546%. Today gold is benefitting from foreign central banks acquiring gold, like Bank of China, safe haven investing, and de-dollarization, where the BRICS are looking to weaken the US dollar by trading in commodities and nondollar currencies. A weaker dollar should drive higher gold prices in the years ahead. Furthermore, gold stocks are especially attractive as the value of these miner’s assets (gold) has tripled since 2015. See chart below.
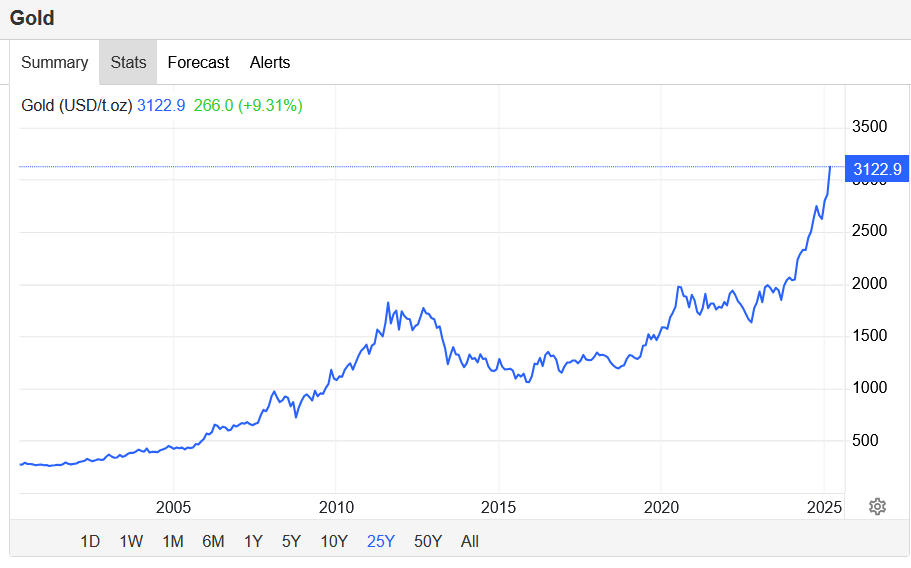
Source: Tradingeconomics.com
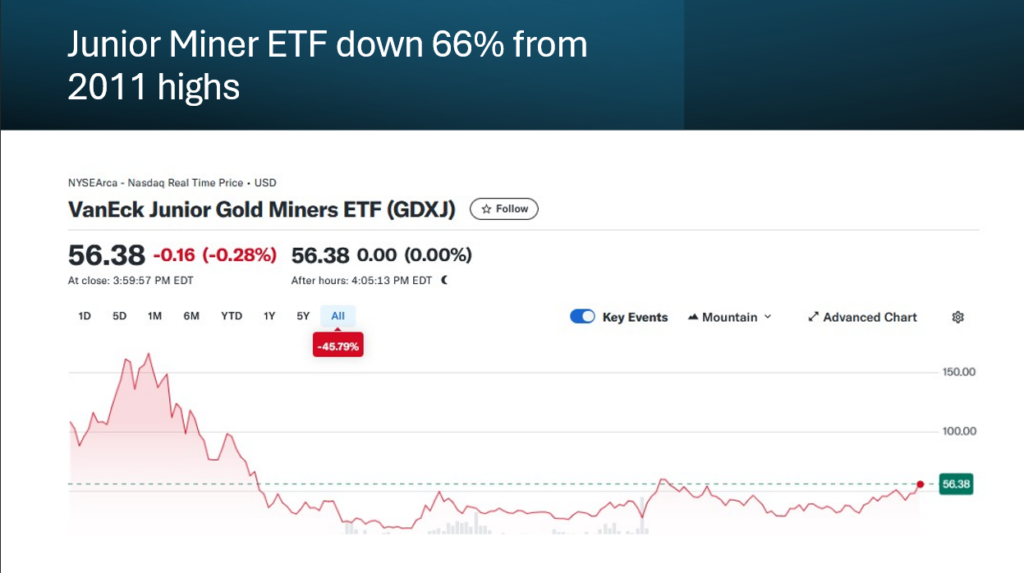
Gold miner performance is shown in the chart below with the metal represented by the SPDR Gold Shares (GLD) candlestick chart and gold miners represented the VanEck Gold Miners ETF (GDX) by the thin rose line and the VanEck Junior Gold Miners ETF (GDXJ) by the thin green line. Gold stocks historically track earnings and earnings surprises. With the rise in the price of gold, earnings should predictably rise and drive gold mining stocks in the coming quarters while most other equities are faced with uncertainty.
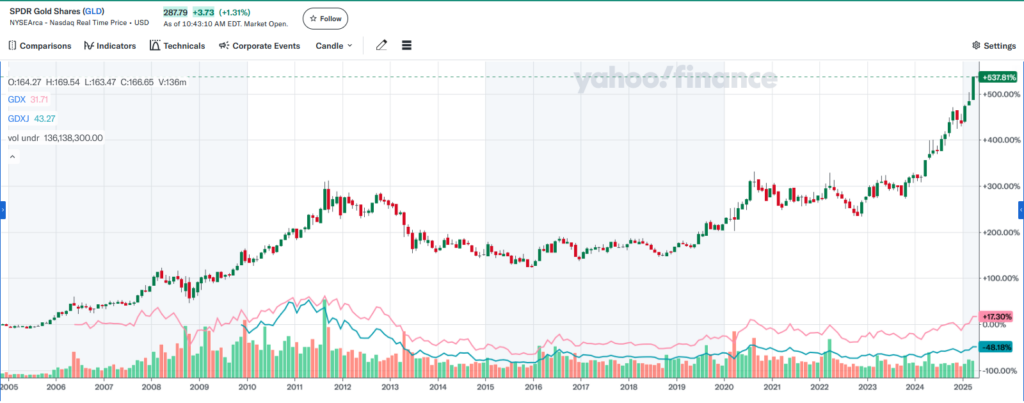
To illustrate how cheap junior gold miners are today, despite the rise in the price of gold since 2011, the VanEck Junior Gold Miner ETF is one third of where it peaked in 2011. It seems reasonable that the VanEck Junior Gold Miner ETF should experience a tripling to recapture its 2011 highs. If a protracted period of economic instability, inflation, and de-dollarization persists, even greater upside could be realized by junior gold miners.
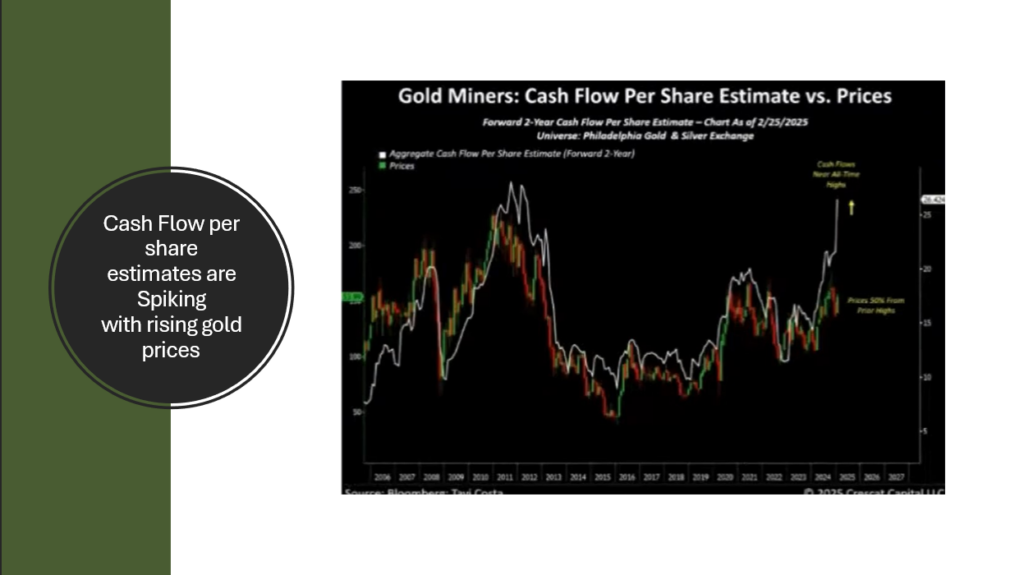
Tavi Costa at Crescat Capital charted just how dramatically cash flows are rising relative to the Philadelphia Gold and Silver Exchange Index (XAU) in the chart below. A 50% rise in the index would seem appropriate, based on the forward two year cash flow estimate for the XAU. That upward momentum in gold stock shares should feed on itself, like any persistent market trend.
Alternative to a 60% Stock 40% Bond Portfolio:
With these investment themes in mind, we constructed a $2 million portfolio for a retired investor interested in gold stocks, diversification, and about 5% income. The portfolio utilizes several closed end equity and bond funds as well as high-yielding international stocks and yields 7.73%. The takeaway is that years of underperformance in international and emerging markets has created yield opportunities that are diversified and uncorrelated to a 60% cap weighted equity 40% bond portfolio.

Recency Bias
Recency bias is the psychological investment phenomenon where people overweight recent experience and excessively discount the long term historical record. We believe that the recent rise in interest rates will lead investors to unwittingly believe that interest rates will trend lower. This favorable interest rate bias will also mislead investors into believing that great returns will continue to come from stocks, bonds, and real estate, but their historic double digit returns have been the result of declining interest rates that are unlikely to persist.
Conclusion:
The resurgence of inflation and rise in interest rates, since 2020, has fundamentally changed the return prospects for stocks, bonds, and real estate for the next decade. The nearly four decades of declining rates from 1981 to 2020 provided a powerful fundamental factor and valuation driver for equities, bonds, and real estate.
The next decade is unlikely to enjoy declining interest rates and declining inflation. This shift in fundamental factors underscores the inflationary and deflationary cycles since 1887 presented earlier. As a result of the parabolic boom in US equities, new leadership will likely come from other assets and geographies. International and emerging market stocks and commodities and commodity stocks are likely to be the sources of new leadership. In the years ahead, double digit returns will most likely be found in assets classes or industries like precious metals mining in the years ahead. In addition, potentially great returns are likely to be found in emerging markets like Argentina, Peru, Hungary, Hong Kong, South Korea and potentially Russia and Ukraine if peace is found there.