Three ominous metrics compel a strategic rotation into out-of-favor equity and commodity sectors to preserve long-term investment capital. With the return of inflation and a generational shift out of low interest rates, overlooked small, value, foreign and high-yield equities, as well as inflationary- hedges offer compelling new investment sectors to preserve your long-term capital. With exuberant sentiment, broad based equity overvaluations, and perilously high federal deficits, Income Growth Advisors, LLC recommends out-of-favor investment sectors that are gaining momentum.
Over the decades, global capital markets have experienced bull and bear markets. Since 1982 and since the Great Financial Crisis, in particular, US stock, bond and real estate markets have enjoyed multi-decade bull markets powered by disinflation, low, and declining interest rates. Unfortunately, beginning in 2020, interest rates bottomed out, and in 2021 inflation emerged for the first time in decades. This new inflationary and higher interest rate regime has shocked global markets. The 2020s’ new higher interest rate regime is leading to a systemic rotation from stocks, bonds, and real estate and into dormant and out-of-favor sectors which were not beneficiaries of deflation and artificially low interest rates.
Consequently, historic analogues suggest that investments which are not interest rate sensitive and benefit from higher levels of inflation can provide meaningful outperformance. The 1970s and the 1999-2011 period are two higher interest rate and inflationary analogues when small capitalization, value, international, emerging markets, commodities, energy, and precious metals provided robust returns. These high returns are juxtaposed with anemic return prospects for interest sensitive large capitalization US stocks, bonds, and real estate that we expect over the next decade.
Our asset allocation strategy borrows from the trading strategy of buying dips and selling rallies, and incorporates Robert Shiller’s longer term sentiment and valuation factors to hone our rebalancing policies.
Sentiment:
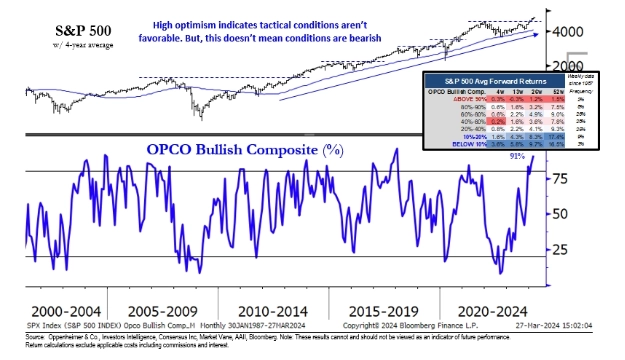
Sentiment is a valuable contrarian indicator. Below is a chart of OPCO’s Bullish Composite which reached 91%, showing near peak optimism. Sentiment extremes are frequently observed near market peaks and troughs. The OPCO chart and historic study of forward return data suggest muted equity return prospects from today’s levels.
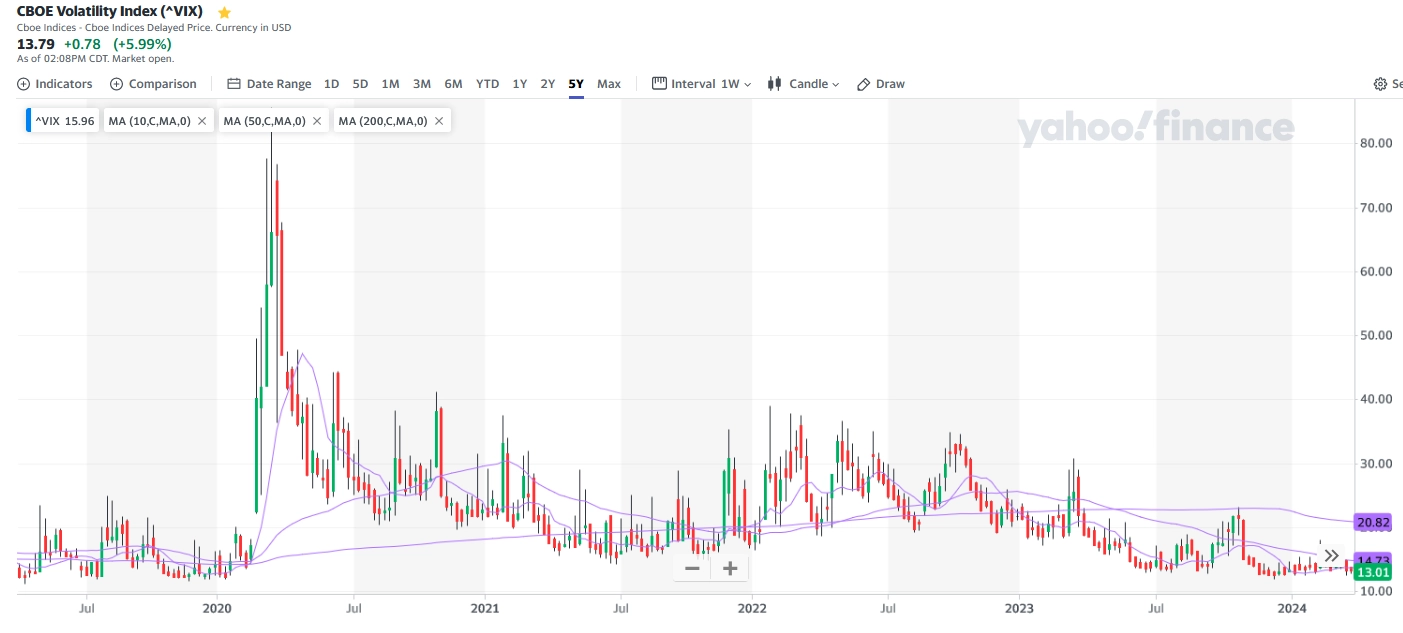
Below is the CBOE 5 year chart of option volatilities. High option volatilities are associated with market bottoms such as in March 2020 during the COVID-19 market plunge when this indicator traded at 80. Today it is near its lows, trades at 13.79, and suggests a market pullback is likely.
Investor Exuberance?
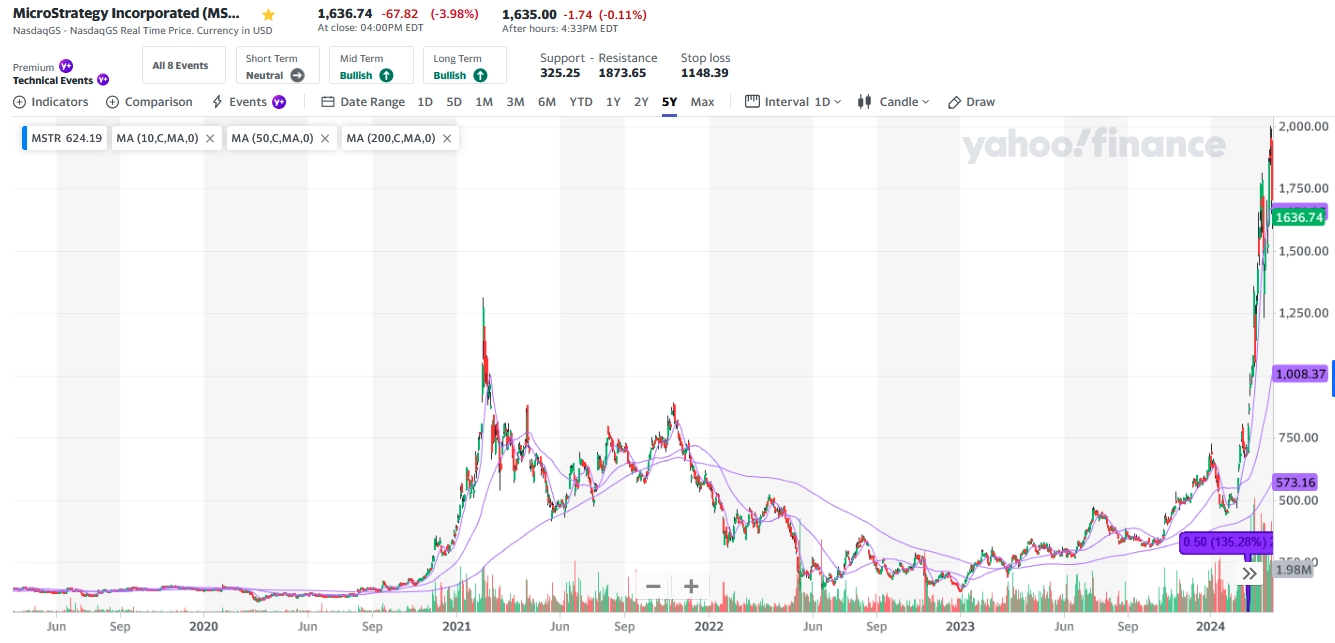
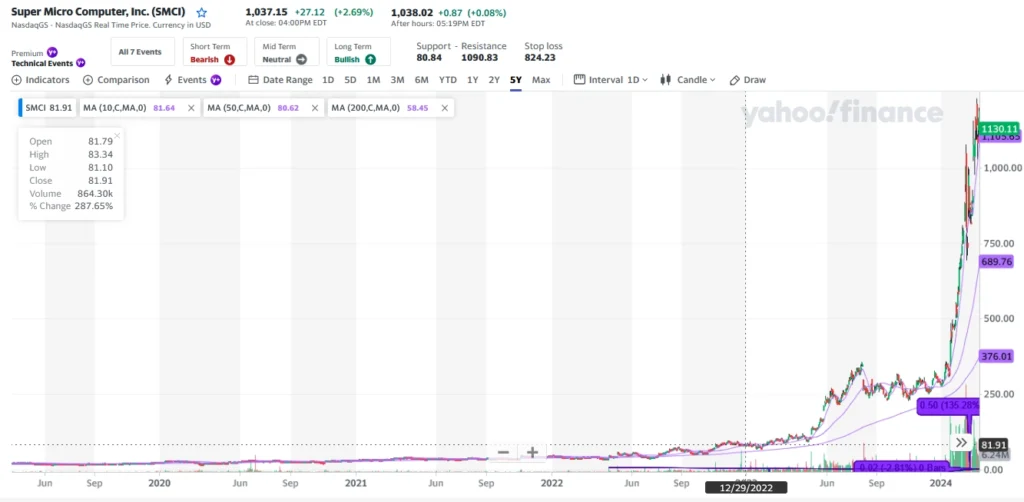
Below are charts of stocks we believe are exhibiting investor irrational exuberance in their price action. Parabolic spikes in stocks and industries often accompany market tops.
Microstrategy: MSTR
Super Micro Computer, Inc. (SMCI)
Invesco QQQ Trust (QQQ). The QQQ replicates the NASDAQ 100 index of large capitalization growth stocks. The QQQ index is a tech heavy long duration investment which should see headwinds from higher interest rates and an ending of artificial intelligence exuberance.
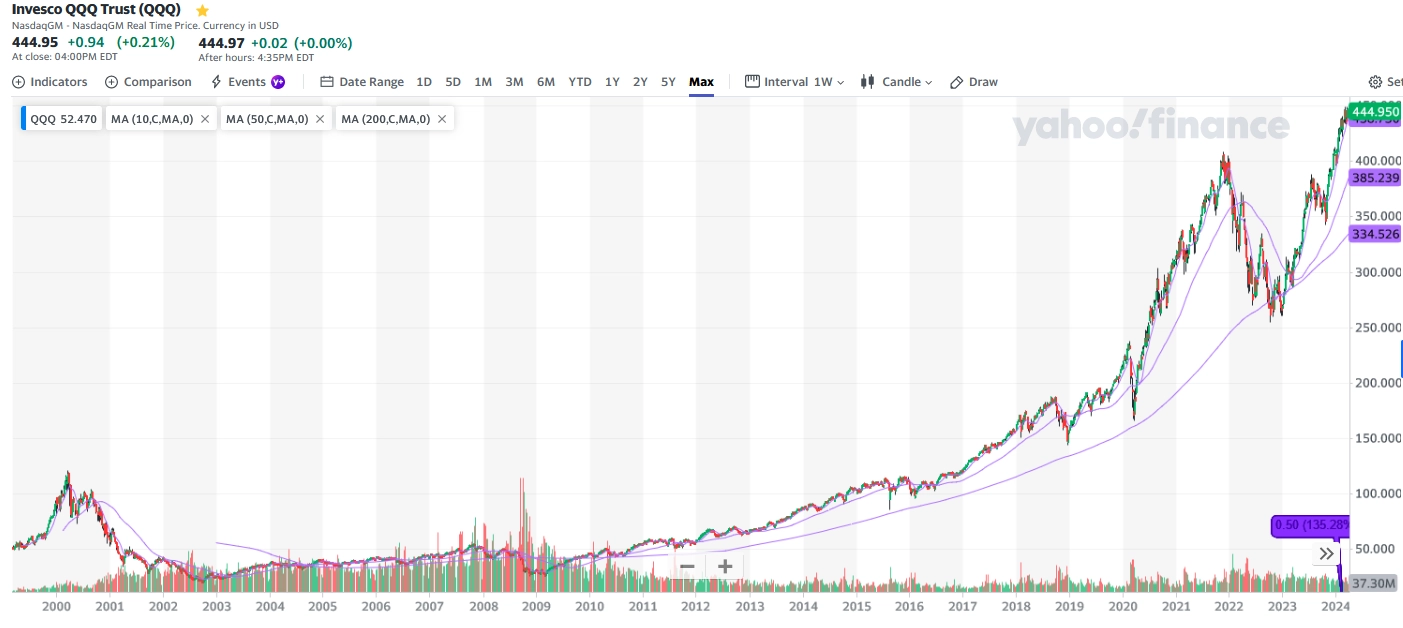
Historically periods which experience parabolic share price action occur at or near market peaks. We would reduce exposure to shares and assets which have had abnormally rapid price appreciation and trade at unusually high valuations.
Valuation:
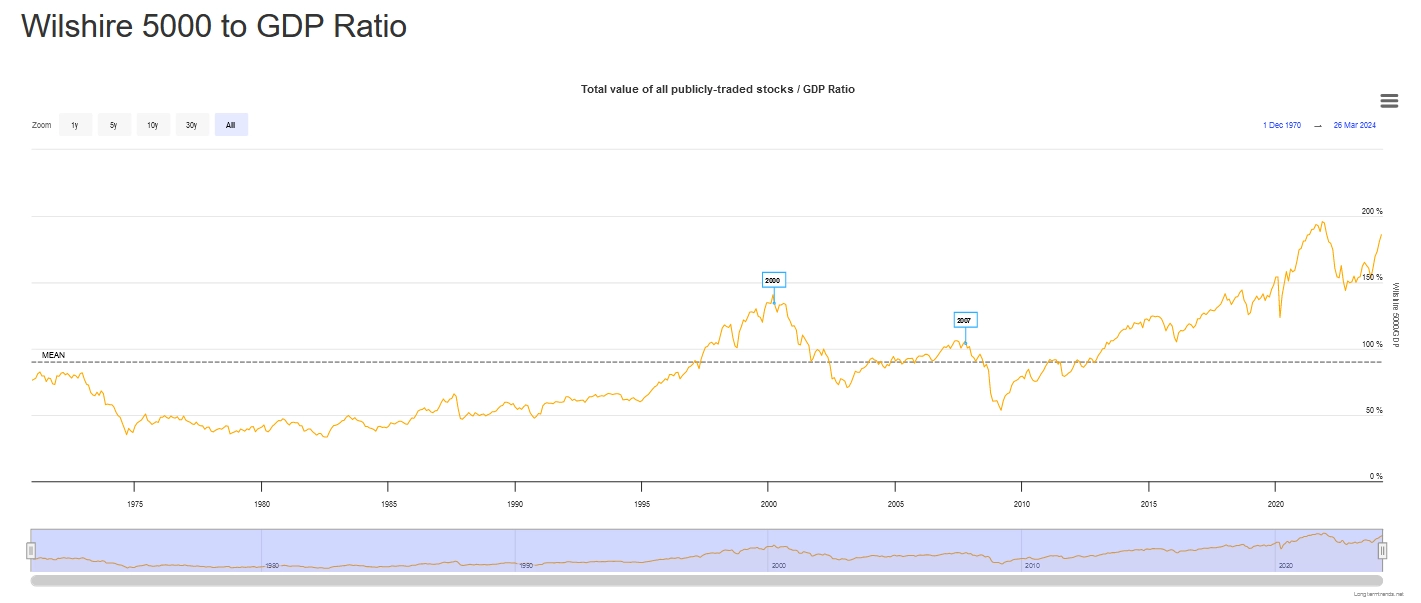
Good returns are most easily achieved when your investments start with an attractive valuation. The “Buffett Indicator,” which compares equity prices versus the Gross Domestic Product, is one of Warren Buffett’s best general market valuation indicators. Today, at 185%, this metric, charted below, is close to its peak of 195% reached in November 2021. 185% stands in stark contrast to its bear market lows of 34% in June of 1982 and 54% in March 2009. This high reading of the ratio (Wilshire 5000/GDP) suggests a more cautious allocation to the equity markets. Caution is particularly warranted with fully priced indices like the S&P 500 and NASDAQ 100.
Buffett Indicator:
Shiller CAPE Ratio:
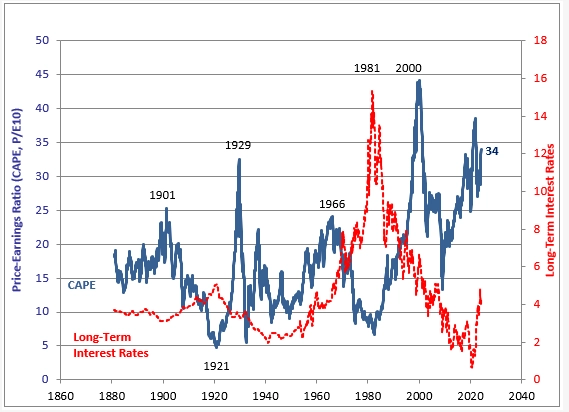
Nobel Laureate Robert Shiller’s Cyclically Adjusted Price Earnings “CAPE” ratio also suggests today’s S&P 500 is near peak equity valuations with a 34 PE ratio over the last 10 years of earnings. This level currently exceeds its peak in 1929, though it is below its April 2000 and November 2021 peak valuations. History has not been kind to investors who have over-weighted equity commitments at peak valuations.
Perilous Government Debt Levels:
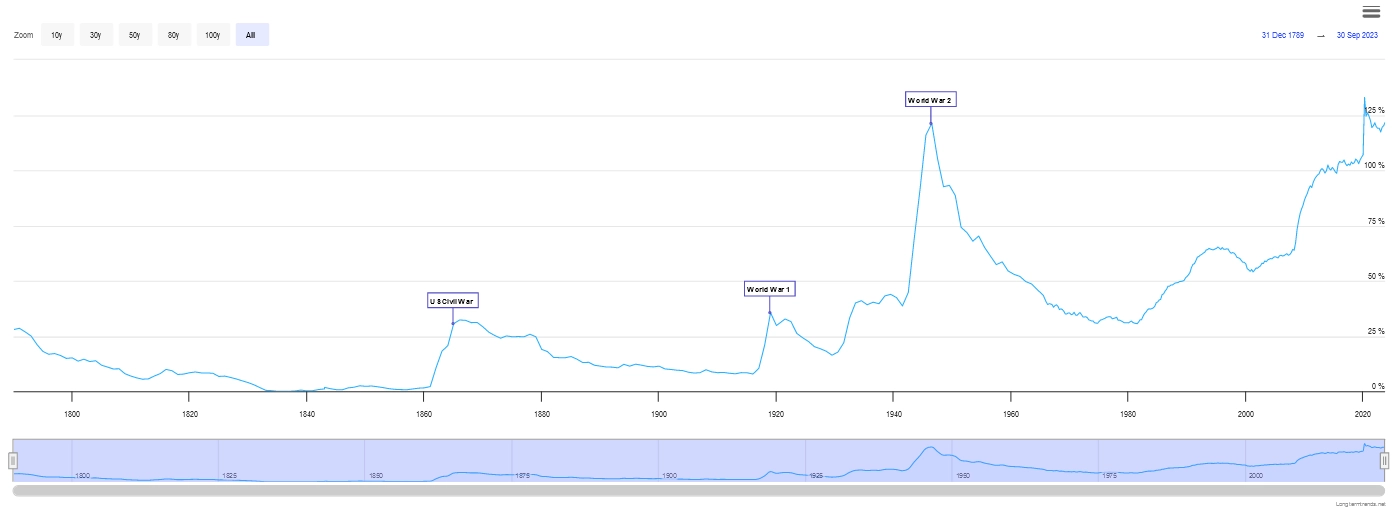
The chart below shows the ratio of federal debt to GDP. Today’s high debt-to-GDP ratios may deter creditors from lending money to the United States. While the United States has a vibrant economy, relative to the rest of the world, today’s debt to GDP ratio suggests the country’s balance sheet is over leveraged and could suffer further damage from unexpected geopolitical, economic, or monetary problems.
Interest Rate Cycle:
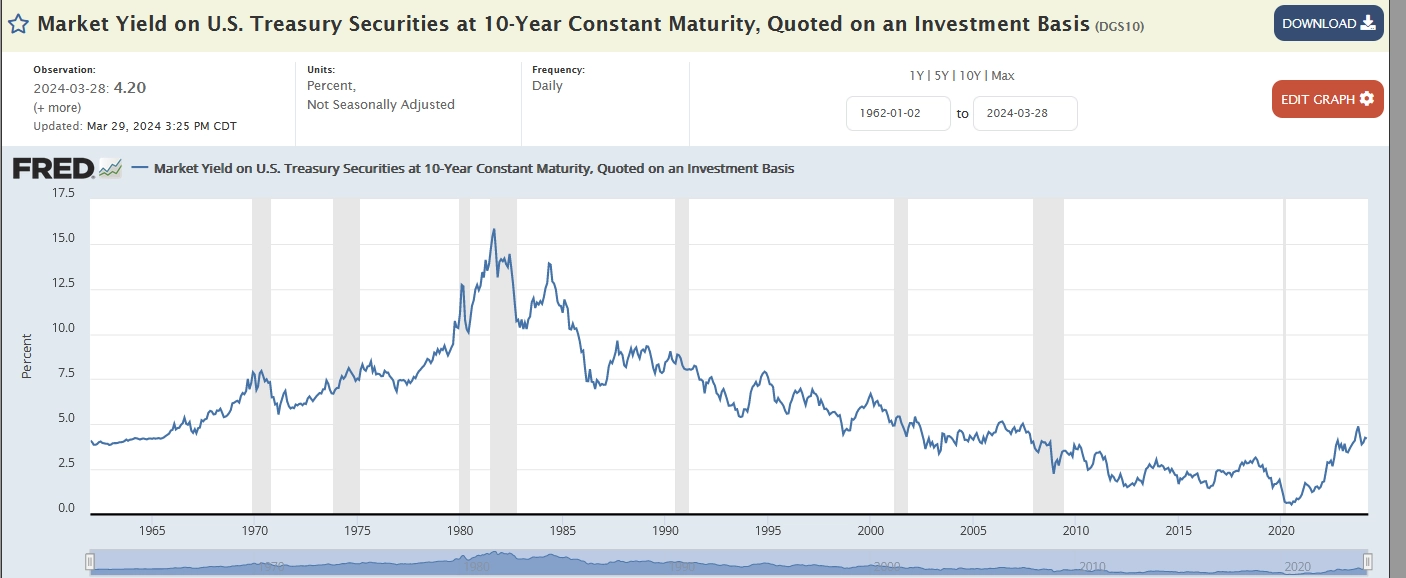
The chart below of the 10-year US Treasury Note yield shows the enormous, four decades long decline in interest rates from 15.84% in November 1981 to 0.55% in July 2020. This protracted favorable interest rate environment helped stock, bond, and real estate prices, leading some exuberant professionals to say stocks or real estate always appreciate. Today’s 10-year Treasury Note yield of 4.3% appears fairly priced relative to bond yields since 1965.
While the Federal Reserve assures us that inflation is trending downward, this trend is not guaranteed. We remain watchful that the Federal Reserve’s actions do not repeat the failed policies of the Burn’s Federal Reserve, which prematurely celebrated its success in stopping inflation, only to experience a second wave of soaring inflation. US Treasury yields soared from 6.81% in December 1976 to 15.84% five years later. This inflation crisis ushered in the legendary Paul Volker to Chair the Federal Reserve and lifted Fed Funds to over 19%.
Capital markets could experience a resurgence in higher interest rates should inflation remain stubbornly high, should geopolitical fights spiral out of control, and or if commodity prices soar as they did in the 1970s.
Will Inflation Return?
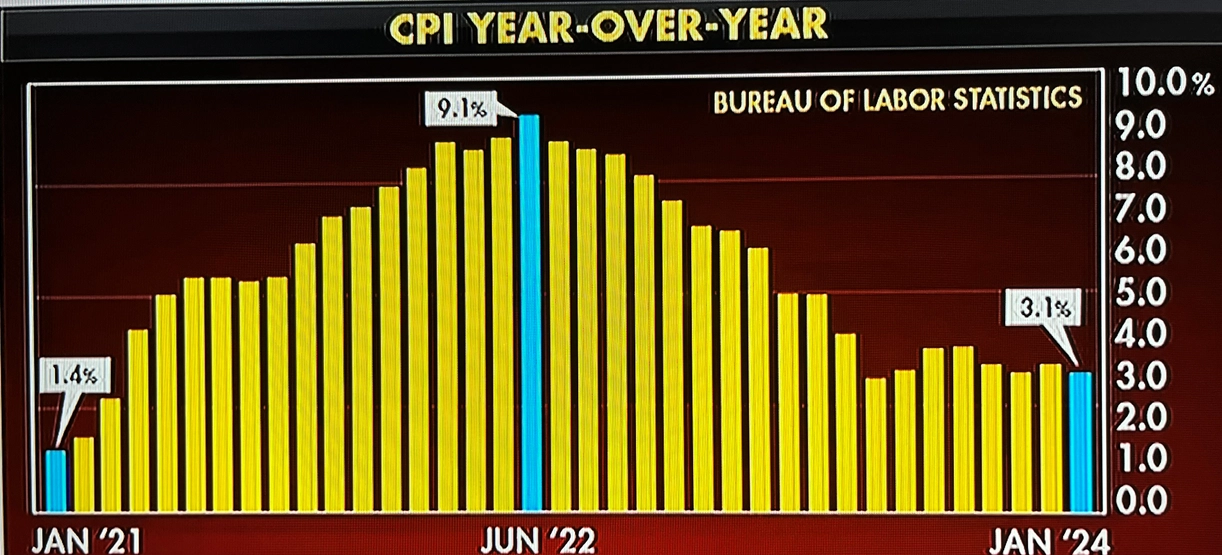
We cannot predict the direction of inflation with any confidence; however, the Federal Reserve had assured us that inflation would be “transitory”, but, to the contrary, it has been durable and damaging. Furthermore, the trajectory of inflation rates (CPI) has flattened out in recent months. The chart below shows the Consumer Price Index rising from 1.4% in January 2021 to 9.1% in June of 2022, before flattening out near 3% in June of 2023. Higher commodity prices and a stronger economy could endanger capital markets.
To fight inflation, the Federal Reserve raised the Fed Fund rate from near 0% in December 2021 to 5.3% in September 2023. This sharp tightening cycle led many, including ourselves, to expect an economic slowdown and a decline in S&P 500 earnings. However, the tightening actions of the Fed merely normalized interest rates and the economy has enjoyed a soft landing where GDP has remained positive and continues to surprise investors. Unfortunately, inflation did not drop to levels where the risk of spiraling inflation has been removed and a higher interest rate and inflationary environment could resurface. This inflationary cycle prospect could be problematic for interest rate sensitive stocks, but commodity and industrial sectors could experience robust economic demand as supply chains are replaced following decades of offshoring and these sectors could emerge as new market leaders.
Rational Rotation: Sectors and Assets that Look Attractive:
Below are several charts illustrating stocks, assets, and sectors which are overbought and other charts showing newly emerging or out-of-favor stocks, assets, and sectors where new leadership could emerge.
Below is a chart of the ratio of the Wilshire US Large-Cap Growth Index to the Wilshire US Large-Cap Value Index. The ratio peaked in 2000 during the tech bubble and growth stock underperformed relative to value stocks until 2007. Value stocks usually have low P/Es, low book values, low price to cash flows and attractive dividends. We believe reallocating to value out of growth makes compelling sense.
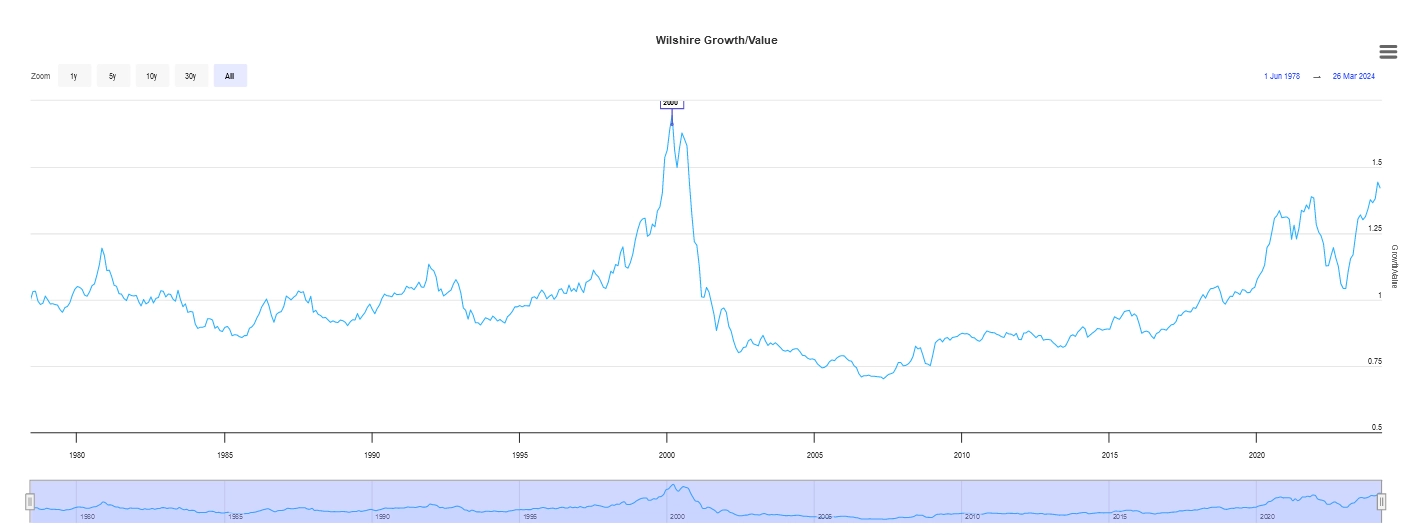
Source: longtermtrends.net
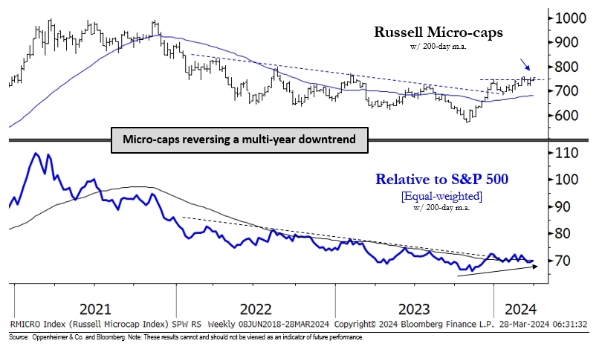
Since the early 1980s, Wall Street has become increasingly computerized, and indexation and ETFs have driven trends to extremes under the guise of diversification. Microcaps and small caps have not enjoyed the benefits of indexation and now appear to be gaining appeal. The chart of the Russell Micro-caps below illustrate a sector where we believe outperformance could persist for years.
Micro capitalization stocks:
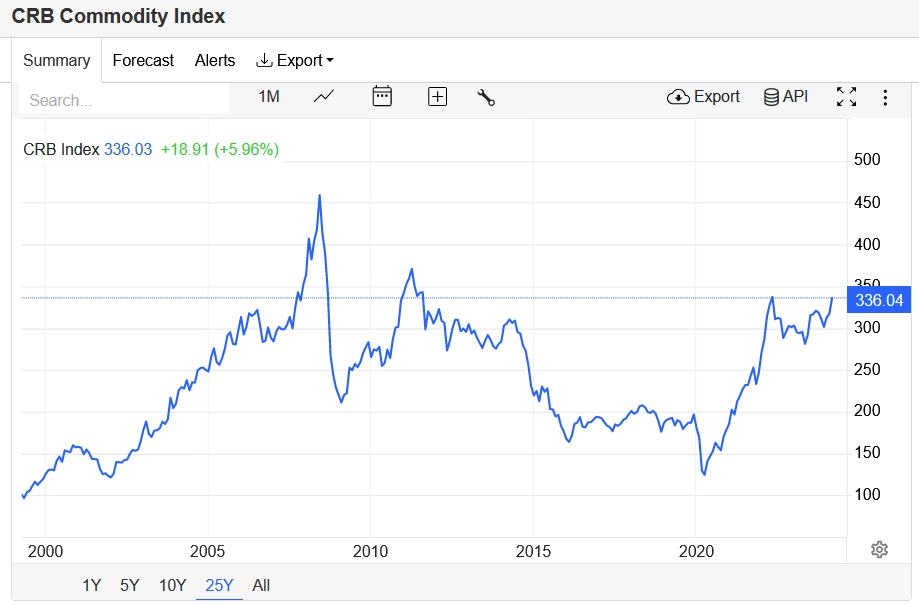
The CRB Commodity Index, in the chart below, appears to be breaking out. Both gold and oil are commodity sectors where we expect durable outperformance in today’s unfolding inflationary cycle.
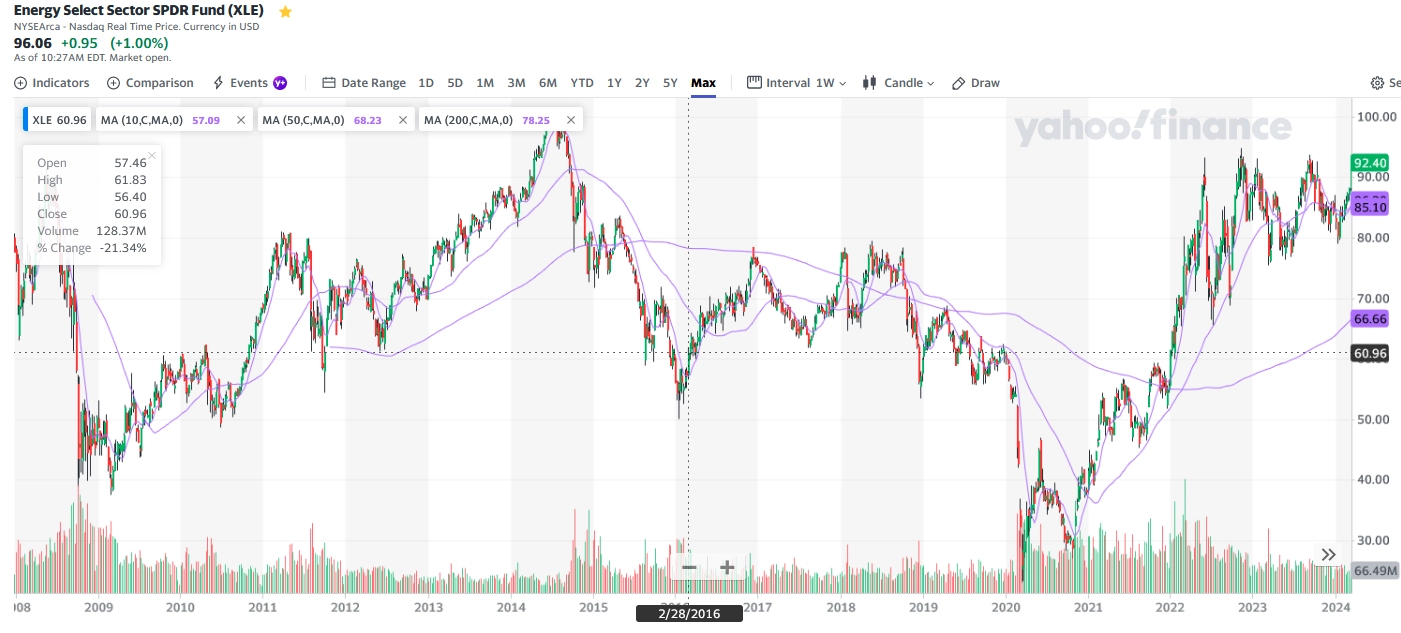
The Energy Select Sector SPDR Fund (XLE) is poised to break to new highs and many energy stocks offer meaningful upside, low valuations, and attractive income.
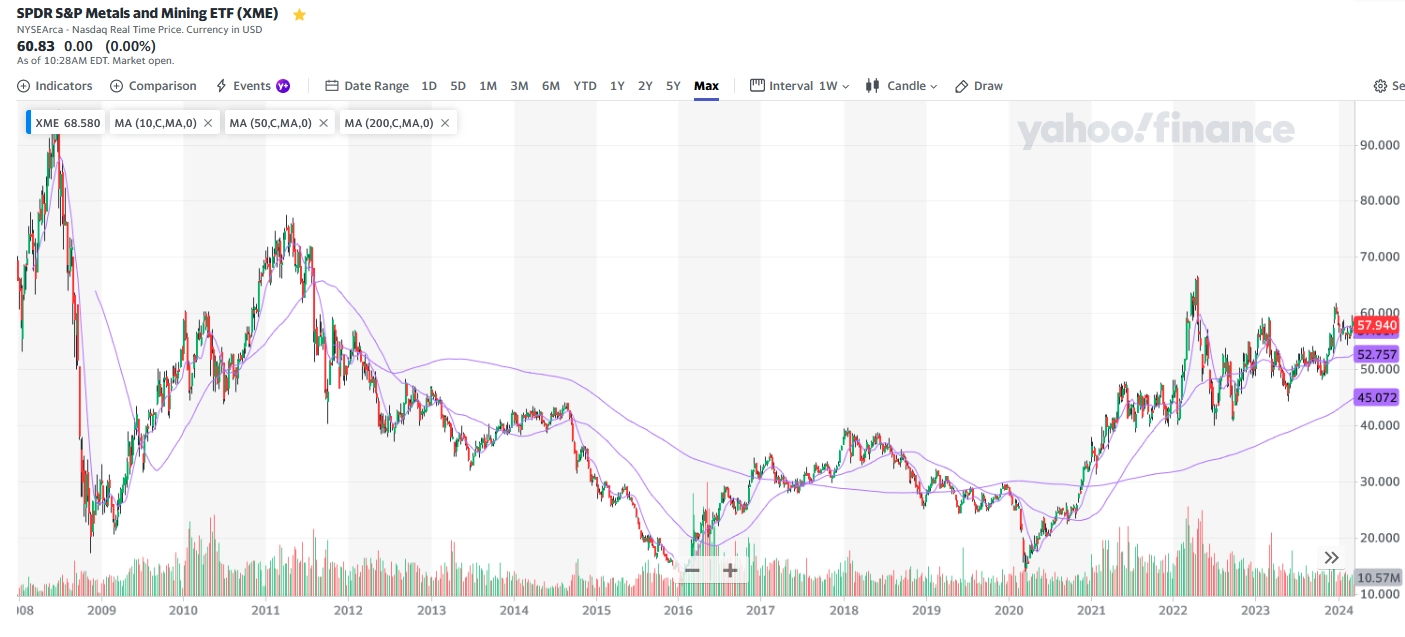
The SPDR S&P Metals and Mining ETF (XME) is poised to break to new highs as well. Metals and mining will benefit from the energy transition and onshoring as the world looks to reduce reliance on China as a major producer of consumer products.
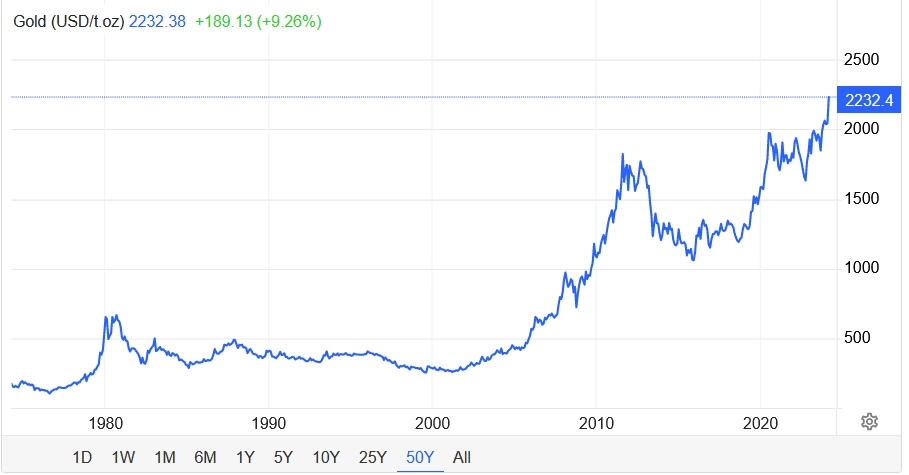
Gold is breaking to higher levels. Gold is an excellent alternative investment that is largely uncorrelated with stocks, bonds, and real estate. There are numerous ways to own gold or gold beneficiaries and we expect gold to provide performance and diversification to our client portfolios this year and in the years ahead.
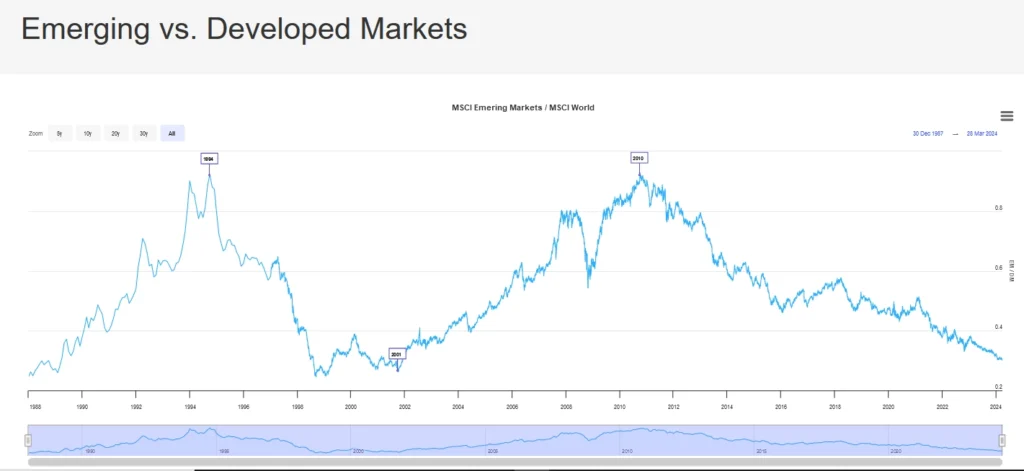
The emerging markets have been underperformers relative to the developed markets since 2010. We believe that as the leadership baton is past from US large capitalization growth, emerging markets will prove fertile markets for growth in the years ahead. Argentina is one particularly inexpensive emerging market that we believe could provide a long period of meaningful returns, especially if its new libertarian President Javier Lilei successfully reduces government and stimulates growth in the private sector. YPF Sociedad Anonima (YPF) is the country’s national oil company and could be a big winner of government reform and country’s enormous natural resources.
Source: Trading Economics
Conclusion:
Today, we see cautionary warning signs for the US stock market, inflation, and the US monetary system. Sentiment is broadly optimistic and is near levels associated with major market tops. Equity valuations are similarly near historic peak levels. Warren Buffett’s favorite market cap to GDP market indicator is close to all-time highs, and those highs are often coincide with major market peaks. Furthermore, Robert Shiller’s CAPE ratio is currently 34, a level which exceeds the peak in 1929 before the stock market collapsed and the Great Depression ensued.
We believe that today’s broad overvaluations are the result of four decades of declining inflation and favorable low interest rates which created a market that is overvalued by many dependable measures. Lastly, the US debt to GDP ratio is signaling that the US, the leading global economy, is overleveraged and potentially at risk to a variety of factors. For these reasons, international investing and emerging markets may prove excellent sources of investment diversification to client portfolios.
The greatest dynamic economic risk is a potential resurgence in inflation. The Federal Reserve has not demonstrated a great record in reducing inflation, and commodities appear poised to break to new highs. If higher commodity prices re-engage, accelerated by growing international conflict, it could lead to higher inflation and higher interest rates. Higher inflation and higher interest rates will be problematic for stock and bond performance, but will be great for gold, oil, and commodity investments in the years ahead.
Investor psychology is widely governed by recency bias. By looking at markets over long periods of time, one can gain appreciation for markets which have gone to extremes, both overbought and oversold. We believe that today, those invested in a 60% large cap growth portfolio and 40% long term bond portfolio will be at risk of underperforming in the years ahead. By diversifying into small capitalization equities, value equities, international and emerging market stocks, inflation hedges like gold and energy stocks, and commodities, investors will improve their return prospects and reduce their portfolio risk.