- S&P 500 earnings have turned up and should drive a final top in the S&P 500 and NASDAQ.
- Equity risk premiums are dropping, signaling stock market risks are rising.
- Rising commodity prices should lift energy and mining investments but could upend the Federal Reserve’s inflation fighting efforts.
- Trouble lies ahead if rising commodity prices cause higher inflation, higher interest rates, and lower corporate earnings in the quarters ahead.
- The 1970s and the 1999-2011 period are good global economic and market analogues for investment strategy today.
The era of declining interest rates is over. Since 1982, interest rates and inflation have steadily declined and created a four-decade long bull market in bonds, stocks, and the 60/40 asset allocation strategy. Today, stocks are in a final blow off run with S&P 500 earnings pushing higher. Unfortunately, we have entered an inflationary period where recent gains in lowering inflation will be challenged with rising commodity prices. Furthermore, recency bias will keep investors and strategists sticking with what has performed well in recent decades, when an investment strategy designed for the 1970s or 1999-2011 period is more appropriate.
In short, an investment strategy of 25% cash, 25% commodities, 25% equities, and 25% bonds should provide a sound asset allocation strategy that should outperform the 60% stock and 40% bond asset allocation strategy for the rest of this decade. The 25/25/25/25 strategy has less market risk, better inflation protection, and better income which is especially important to retirement age investors. Because the 60/40 strategy was the cornerstone of asset allocation and financial planning strategies for the last 40 years, it will be difficult for some investors to make sensible tactical asset allocation adjustments due to their recency bias. We foresee a prolonged period of out-performance for energy (brown and green), minerals, small capitalization, value, international and emerging market equity investments. Conversely, reducing investments in popular investments and strategies championed over the last forty years like large capitalization growth stocks, long duration bonds, and the 60/40 allocation strategy should help many portfolios derisk and outperform.
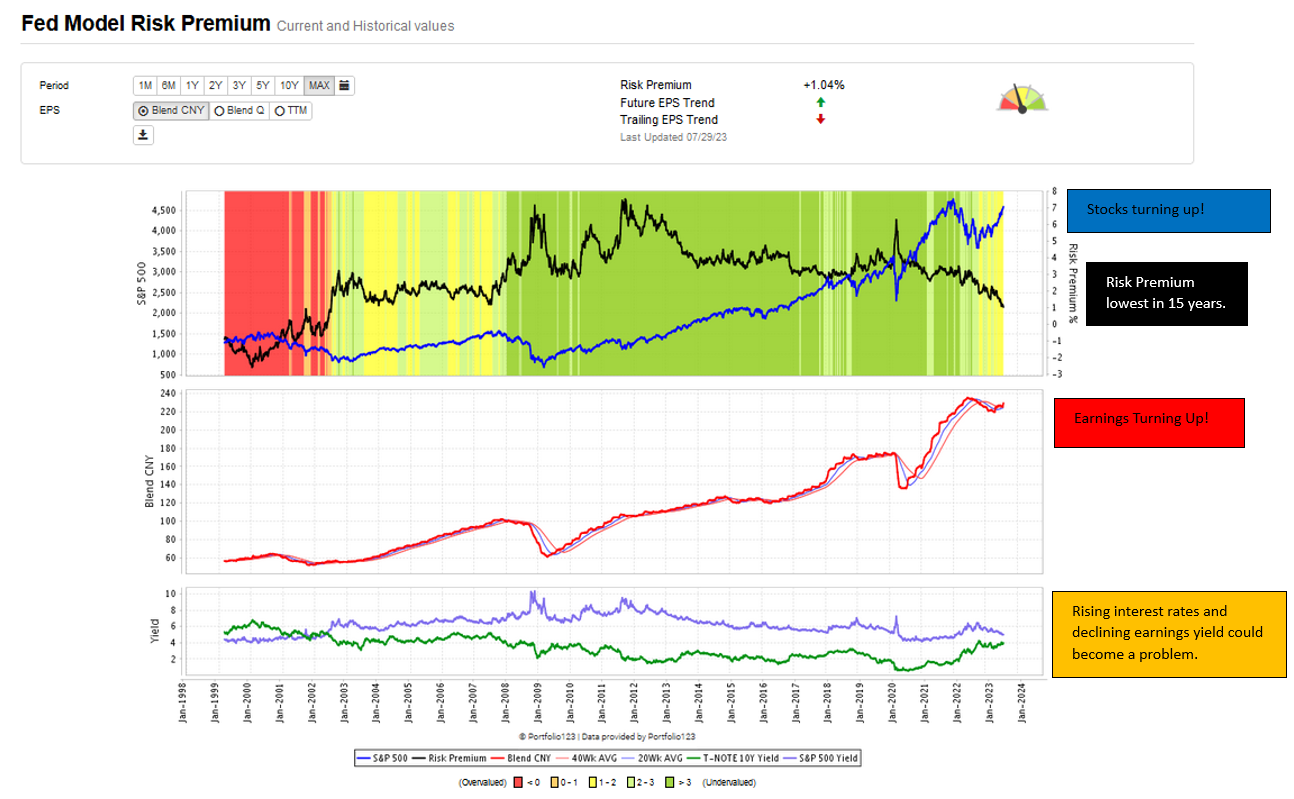
The chart below of the Risk Premium Model or “Fed Model” shows three important developments:
- Estimated S&P 500 earnings have turned up.
- The risk premium has declined to a cautionary 1% level.
- The 1.04% risk premium has dropped to levels not seen since July 2002 and could turn negative if interest rates and inflation, driven by rising commodity prices, rise further.
- Furthermore, an economic recession could lead to a sharp decline in earnings which could also turn the risk premium negative, an overvaluation condition not seen since the 1999-2003 technology bubble.
Trouble Ahead?
Rising commodity prices could lead to higher inflation and lead to further Federal Reserve tightening. Higher interest rates could undermine the current stock market rally, but we see the market pushing higher in the quarters ahead.
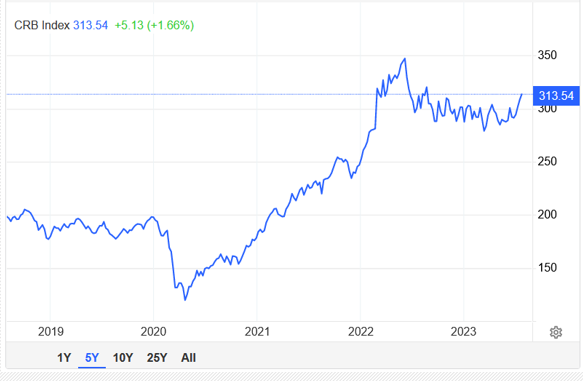
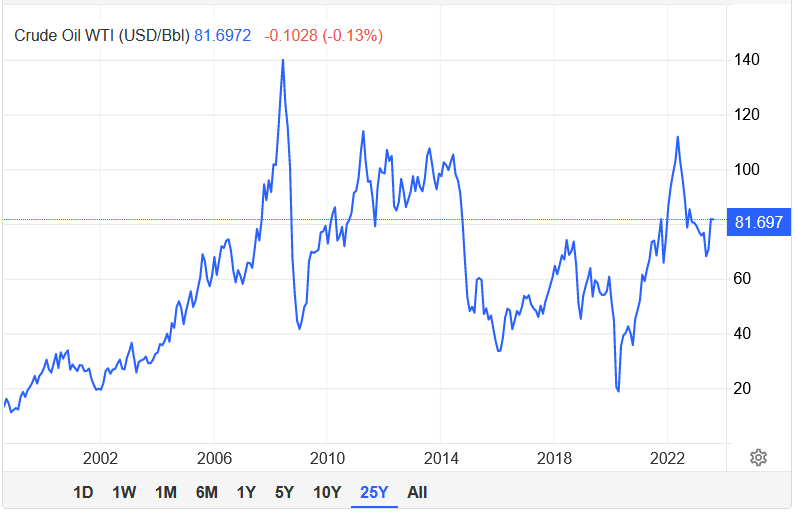
The chart below shows a 300% rise in the Commodity Research Bureau “CRB” Index off the March 2020 low. Since June of 2022 the CRB index had declined 19% and is now turning up. Natural gas declined nearly 80% since last June and West Texas Intermediate “WTI” Crude oil declined from $117/bbl to $63/bbl and now is rising. Attacks on Ukrainian food storage and ports could also drive higher food prices.
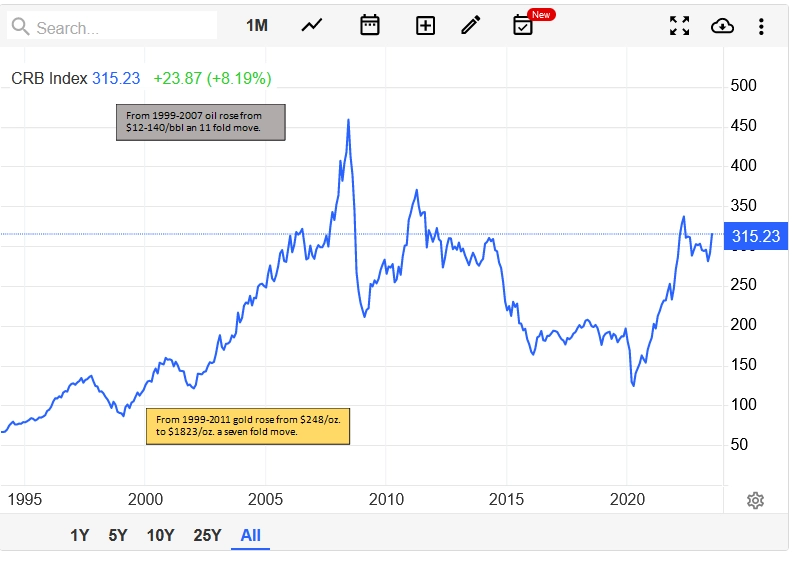
A long-term chart of the CRB shows a huge four-fold commodity bull market from 1999 to 2011. The 1999-2011 period is an inflationary market analogue where equities were largely flat but oil and gas had massive price appreciation. Oil rose from $12/bbl in January 1999 to $140/bbl in June 2008 a twelve fold move. Gold rose from $248/oz. to $1823/oz. a seven fold move.
The Inflationary Cycle Returns:
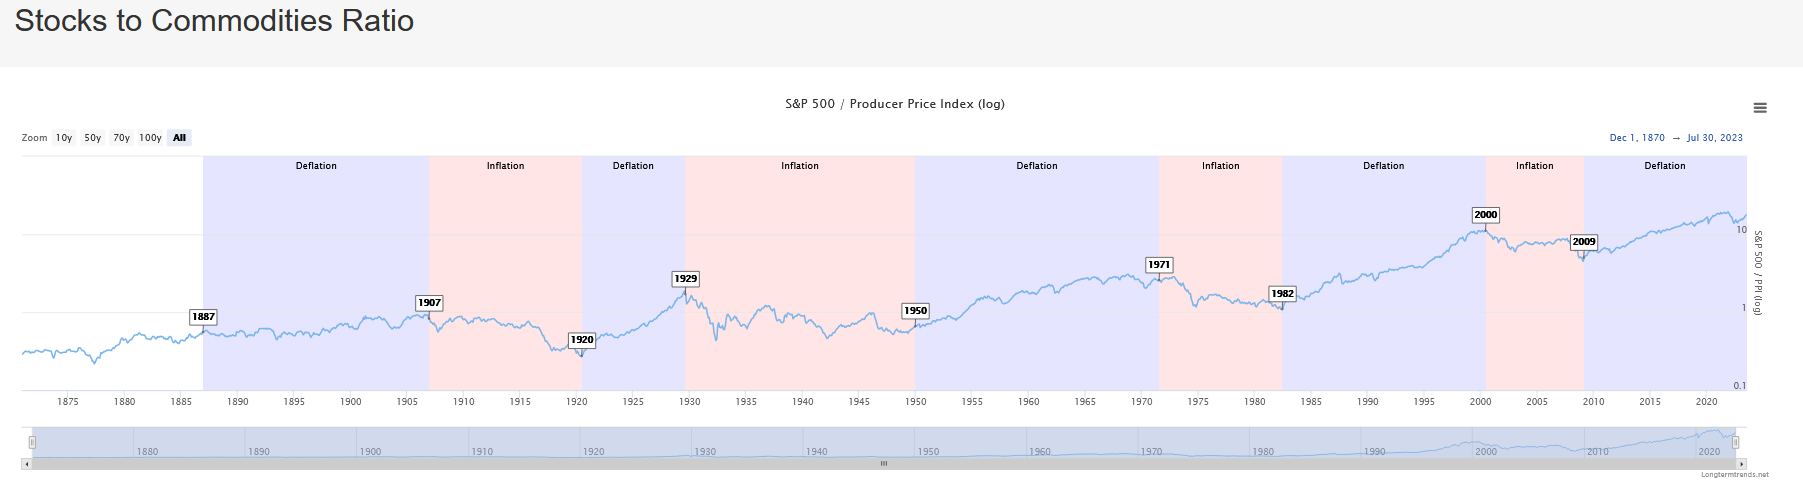
The chart below shows the S&P 500 divided by the Producer Price Index (log scale) since 1885. This ratio chart delineates inflationary and deflationary cycles into one to two decade periods. Deflationary periods created exceptional S&P 500 bull markets and equity returns e.g. 1920-1929, 1982-2000, and 2009 to the present. Likewise, inflationary cycles like the 1970s and 2000-2011 created substantial bull markets in commodities. For this reason, if we are correct in our belief that we are in a new inflationary cycle, then reducing equity allocations in model portfolios from 60% to 25% equities is sensible. Furthermore, investing up to 25% in commodities, like gold and oil, could generate substantial outperformance and provide inflation protection.
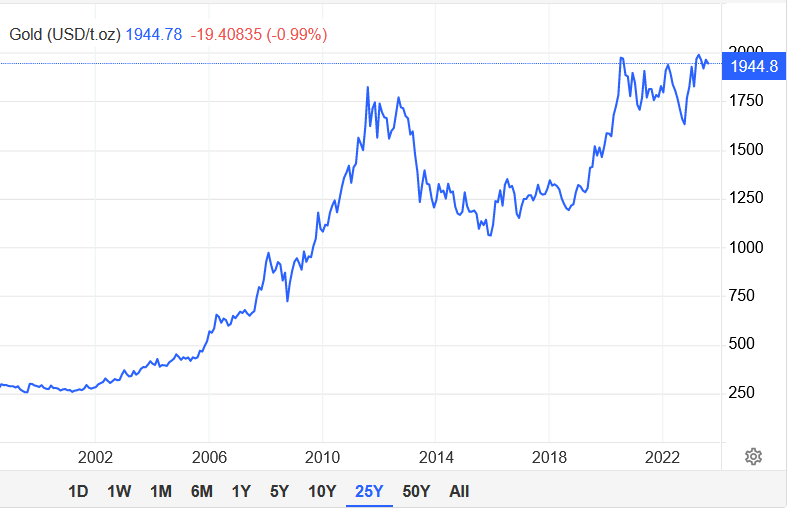
Investing in gold and oil as representative commodity investments should or could produce meaningful outperformance relative to the S&P 500 index. The 25-year chart of gold below shows the seven-fold performance of gold during the 1999-2011 inflationary cycle.
We don’t advocate owning the physical commodity of gold per se; however, gold proxies such as the SPDR Gold Shares (GLD) ETF or the VanEck Gold Miners ETF (GDX) can offer convenient investment vehicles that provide the same non-correlation and performance profile as the yellow metal, but can offer income and differing levels of risk or beta. Gold mining stocks are near historically low valuation levels. Furthermore, the mining sector has historically low representation in the S&P 500, which often suggests a cyclical low valuation.
Furthermore, oil massively outperformed the stock market in the 1999-2007 period when it rose from $12/bbl to $140/bbl in August 2007. We are not advocating owning actual crude oil per se. There are numerous investments such as stocks and ETFs in the energy sector which can provide the same non-correlated outperformance to the S&P 500 and alpha as oil without the challenges and costs of owning the actual commodity. Shares of energy companies today have a low representation in the S&P 500 relative to their earnings and often offer attractive yields.
Higher commodity prices and inflation could result in further Federal Reserve tightening, a decline in earnings and an equity market decline. In the 1970s and 1999-2011 periods, equities experienced severe bear markets, but commodities provided powerful uncorrelated performance.
Cash and Cash Equivalents:
The Federal Reserve lowered the Fed Funds rate to nearly zero for years following the Great Financial Crisis. The Federal Reserve also accumulated nearly ten trillion dollars in US Treasury securities since the Great Financial Crisis to further stimulate the economy. These strategies created historically low yields which forced individuals into the market of risk assets to secure an attractive yield. This exacerbated bubble valuations in stocks, bonds, and real estate.
Today we are on the other side of this historic monetary accommodation period. Money markets, cash equivalents and short term treasuries now provide an income which can help retired individuals and those living on a fixed income. These safe cash equivalents offer nearly risk free income to investors.
The holding of 25% in cash and equivalents provides an optionality that could prove valuable in the event the market experiences a downturn. If you are heavily invested in stocks as the 60/40 strategy mandates, you would have to sell equities in order to acquire deeply discounted opportunities which occur periodically.
Today the world is unsettled. The Russian invasion of Ukraine has created a palpable risk of a world war and a nuclear incident. China has made imperialistic threats toward Taiwan, and an invasion of Taiwan could easily lead to a market selloff of some magnitude. The market risks we don’t anticipate are the ones which hurt us or the market the most. So while a 25% allocation is quite high, the opportunity cost of holding a large defensive cash or cash equivalent position today has dropped significantly.
Interactive Brokers continues to advertise 4.58% for its money markets. Two-year US Treasury yields are 4.88%. For the first time in over a decade, investors can get yields approaching 5% without undue duration or credit risk. Depending on one’s particular financial profile and risk tolerance, we believe holding up to 25% in cash can provide both income and investment flexibility which could prove quite beneficial the next time the markets panic.
Conclusion:
We live in a world with increasing geopolitical risks that could lead to a sudden market reaction. This week, Fitch downgraded US debt from AAA to AA+. The rating agency pointed to the United States’ high levels of accumulated debt and poor governance which has been demonstrated for years in its Congressional budgetary processes. Because S&P downgraded US Treasury debt in 2011, we know from that experience that the market disruption today should not be cataclysmic because the US Treasury market is still the most secure sovereign debt market in the world; however, investors would be foolish not to see the writing on the wall.
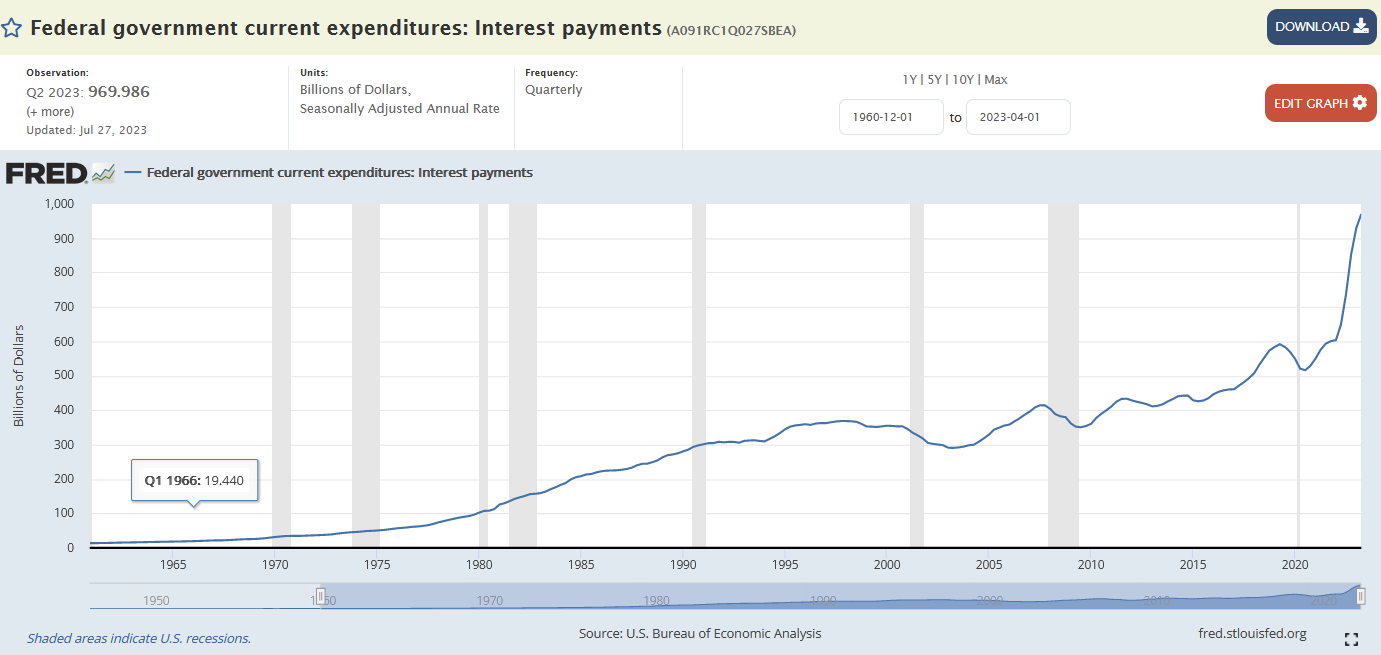
The chart below of the Federal Government’s accelerating interest rate obligations are at nearly $1 trillion per year and rising rapidly. Rising inflation, rising commodity prices, geopolitical conflicts, political discontent, and economic uncertainty support our argument for a 25% cash, 25% commodity, 25% stock and 25% bond portfolio versus the 60% stock 40% bond allocation historically favored by financial planners. Furthermore, the current geopolitical, economic and political environment parallels the 1970s and 1999-2011 inflationary cycles. Lowering equity market risk, duration risk, adding commodity exposure and increasing cash levels is prudent.
Fortunately, there is some near term market hope. S&P 500 earnings projections are turning up and pushing the NASDAQ and S&P 500 higher. Excitement around Artificial Intelligence “AI” is lifting the magnificent seven (Microsoft, Apple, Amazon, Meta, Google, Nvidia, and Tesla) and large cap growth stocks. Though equity valuations are rich, recent upward earnings revisions suggest a short-term leg higher. Rising commodity prices should help historically cheap energy and mineral stocks, broaden the market breadth, and lead to a possible blow off top in the S&P 500 and or the NASDAQ. We suggest trimming extended, overpriced positions, and allocations; and reallocating to cash, precious metals, energy (brown and green), minerals, small capitalization, value, international and emerging market equity investments.