- The market’s decline rests with how severely earnings decline.
- Massive Federal Reserve Accommodation has led to multiple asset bubbles.
- Inflation will be tenacious due to energy and supply chain challenges.
- Today’s inflationary cycle in an investment game changer.
- Natural gas, LNG, nuclear and precious metals should have decade long rallies.
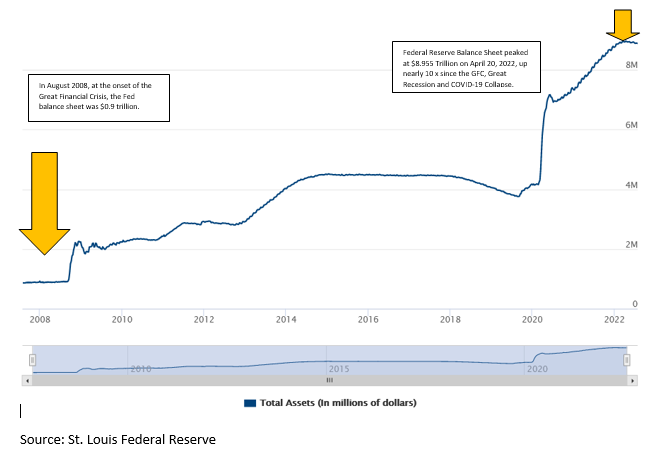
US stock, bond, and real estate markets have entered their second phase of this inflation driven bear market. The first phase commenced in February 2001, with the unwinding of speculative market excesses, historically high valuations for stocks and bonds, and artificially low interest rates created by a hyper accommodative Federal Reserve. Since the Great Financial Crisis, the Federal Reserve has provided near 0% Fed Funds rates and increased its balance sheet ten-folds to $9 trillion through purchases of Treasuries and mortgages bonds. The Federal Reserve is tightening the Fed Funds Rate rapidly and markets are projecting a 3.5% level by year end. During this first phase, equity capital markets lost $14 trillion in equity capitalization; furthermore, both bonds and the 60/40 portfolio mix recorded their worst quarterly performance on record in the second quarter. Real estate sales are slowing due to rising mortgage rates, like the 30-year conventional mortgage, which has nearly doubled and cut mortgage finance availability by nearly one half compared to last year. With the Federal Reserve’s balance sheet still hovering near $9 trillion, it could take years to fully rein in the financial excesses and to tame today’s 40-year high inflation to generate a durable economic recovery.
The chart below is the Federal Reserve’s Balance Sheet, showing a massive expansion in assets which helped the economy through two market collapses and The Great Recession. It also created an unprecedented low interest rate environment which spawned asset bubble valuations due to the absence of credible safe yield alternatives.
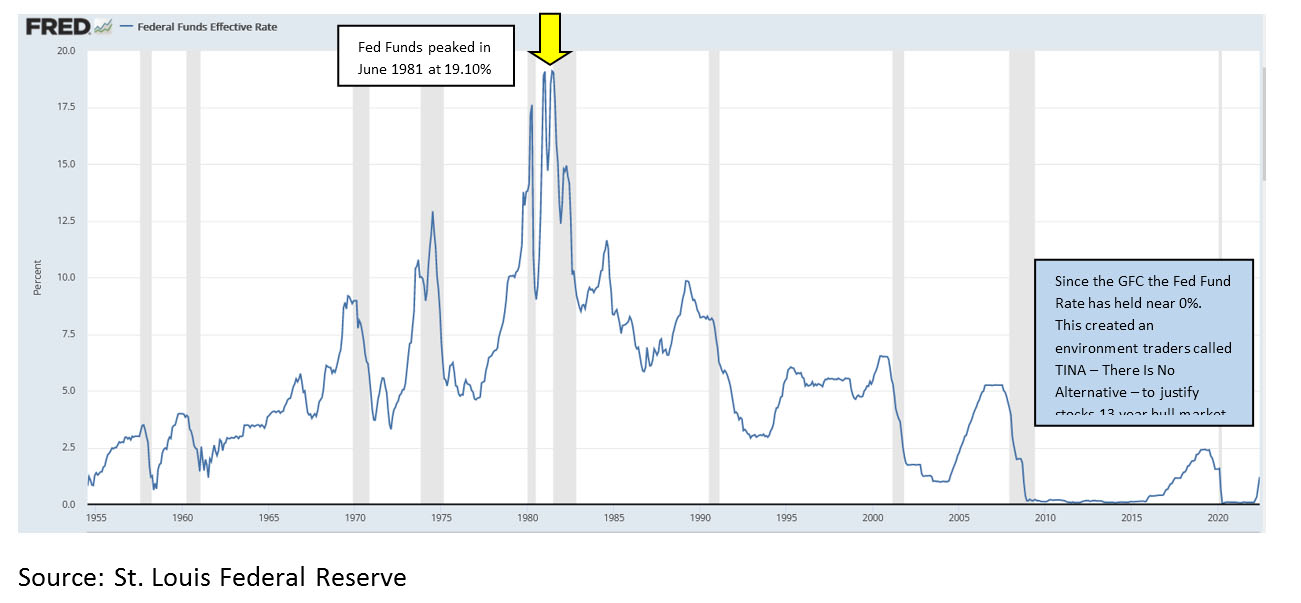
The chart below of the Federal Funds rate shows a decline from 19.10% in June 1981 to near zero and for much of the Great Financial Crisis of 2008, the Great Recession, and the COVID-19 Collapse of 2020. The absence of attractive short or long term treasury investments led to bubble valuations in equities and real estate. These over valuations will revert as interest rate policies normalize.
The severity of the market’s second phase will be defined by the depth of the economic slowdown and the impact of inflation on business and earnings. Since economic forecasting is difficult, we look at historical analogues to gauge the return prospects for stock, bond, and real estate markets. The US economy has entered a technical recession — two sequential quarters of negative Gross Domestic Product (“GDP”). A more severe economic contraction could cut earnings by half. Consequently, monitoring both economic data and earnings trends will be critical in the second half.
The chart below reflects the modest contraction in GDP of the first two quarters of this year.
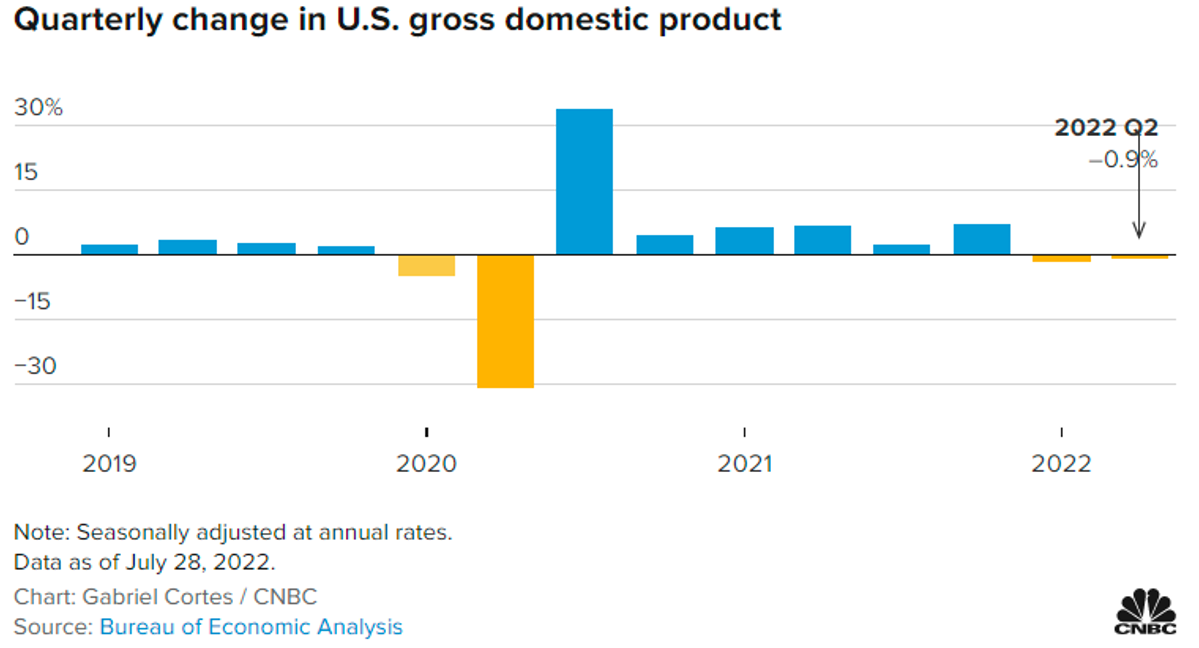
Source: CNBC and Bureau of Economic Analysis
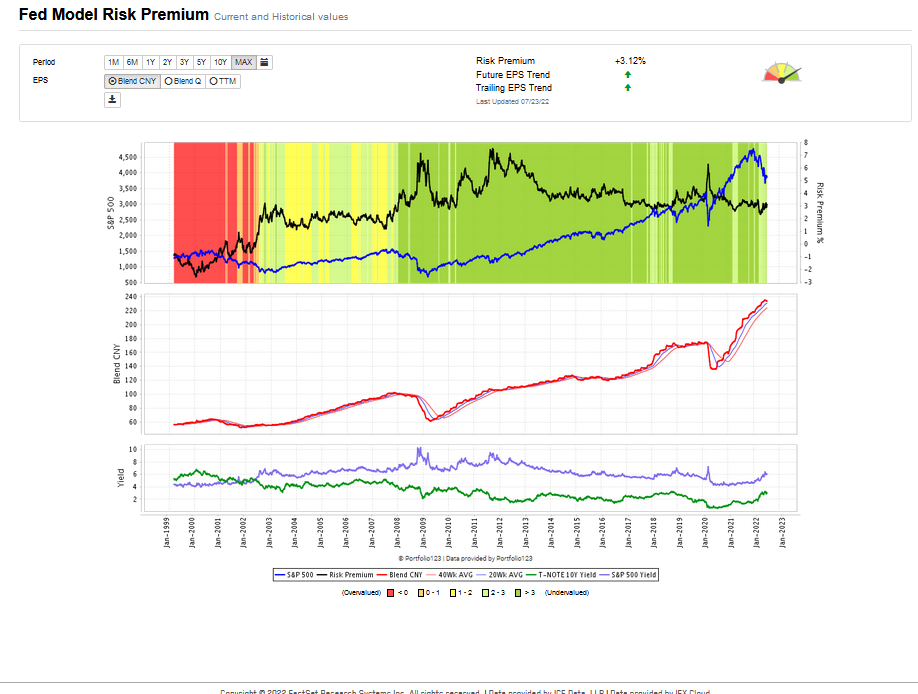
The Fed Model or Risk Premium Model below shows that while the stock market has experienced a sharp decline, the earnings for S&P 500 (shown by the red line in the second panel below) have just begun to top. We expect that as the impact of higher interest rates and inflation weigh on economic activity and profitability, earnings could decline meaningfully. If you look at the S&P 500’s sharpest declines since 1999, these periods correlate with earnings declines during March 2000 – May 2003, Feb 2008 – March 2009, and January 2020 – August 2020. Earnings are just now cresting, and S&P 500 market multiple has declined from 21 to 15 times earnings, but how far earnings decline depends on how the future unfolds.
The key issues will be how quickly will inflation reverse which will allow the Federal reserve to moderate its tightening policy and how much the slowing economy and inflation will shrink earnings.
The chart below shows the steady rise of the CPI from 1.4% in January 2021 to 9.1% last month, June 2022, the highest level in 40 years. We don’t expect inflation will drop as quickly as it rose.
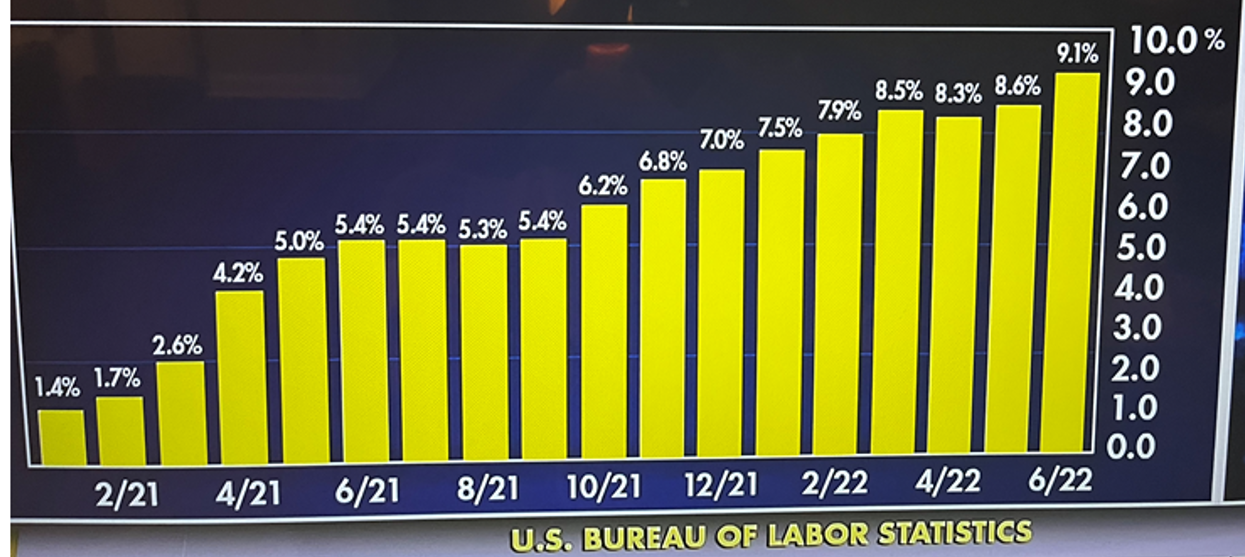
Source: CNBC and US Bureau of Labor Statistics
We believe the bulk of inflation is coming from supply chain problems and energy inflation. Specifically, supply chain issues arose from the COVID-19 collapse, combined with geopolitical factors such as a new cold war with China and Russia, and the Russian invasion of Ukraine. These tenacious problems will not be resolved quickly. Since COVID-19 in 2020, the US has been reducing our supply chain dependence on China. The US has been in-shoring manufacturing and finding alternative international supply chains. This process will come with an inflationary cost and take years. Furthermore, ubiquitous and transcendent energy prices have soared. With today’s unrealistic domestic green energy policy, reverting inflation to the 2% level could take five years or more. This inflation cycle could have a devastating impact on investors especially those holding onto backward looking investment strategies and investments.
The Inflationary Cycle:
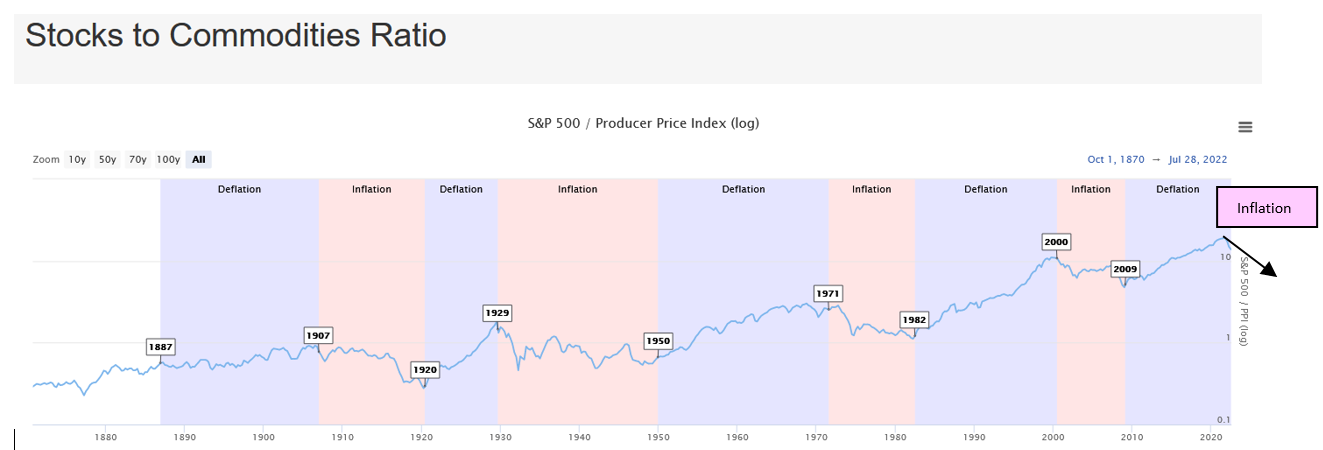
To counter the challenging prospects of traditional index and 60/40 asset allocation, which prospered over 40 years of declining interest rates, we are advocating portfolio construction based on an inflationary or commodity super-cycle framework. The chart below shows market environments delineated as inflationary and deflationary. The 1980s and 1990s were a deflationary environment where the S&P 500 and long duration assets outperformed. Inflationary environments occurred during the 1970s and 1999-2008, both periods had massive decade long oil price bull markets. In the first half of 2020, we have entered a new inflationary cycle.
We recommend a fresh new investment strategy approach which embraces those sectors and investments which outperformed in the past inflationary environments like 1971-1982 and 2000-2009 and investments with compelling fundamental value and earnings growth prospects.
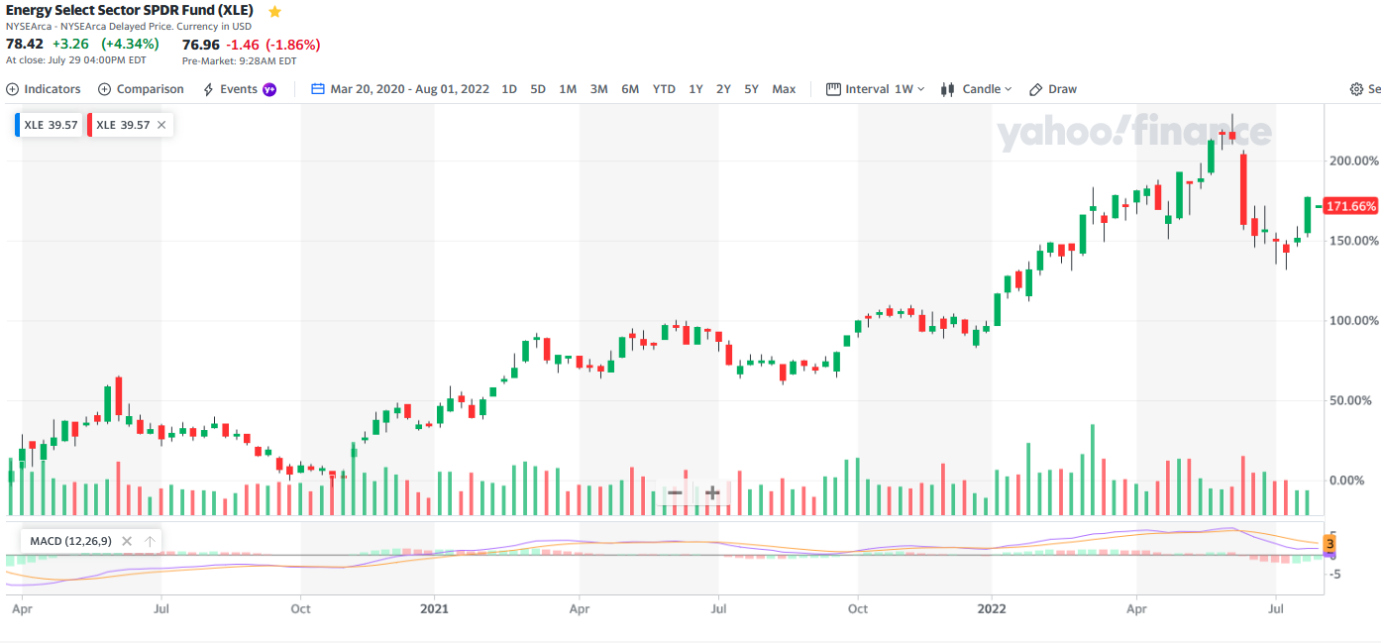
We are sellers of deflationary winners like long duration assets, growth stocks, technology stocks, and bonds, and instead favor inflation beneficiaries and new growth industries including mining, energy, and precious metal physical assets and their miners. Year to date, this inflationary cycle approach has been spot on, as cited by our esteemed colleague William Travis Koldus of KCI Research LTD “as of Friday, July 15th, 2022, the Energy Select SPDR Fund (XLE), was up 26.2% year-to-date in 2022, while the SPDR S&P 500 ETF (SPY), was down 18.3%, the Invesco QQQ (QQQ) trust was down 26.4%, the ARK Innovation ETF (ARKK) was down 53.4%, and the iShares 20+Year Treasury ETF (TLT) was down 20.9% YTD.”
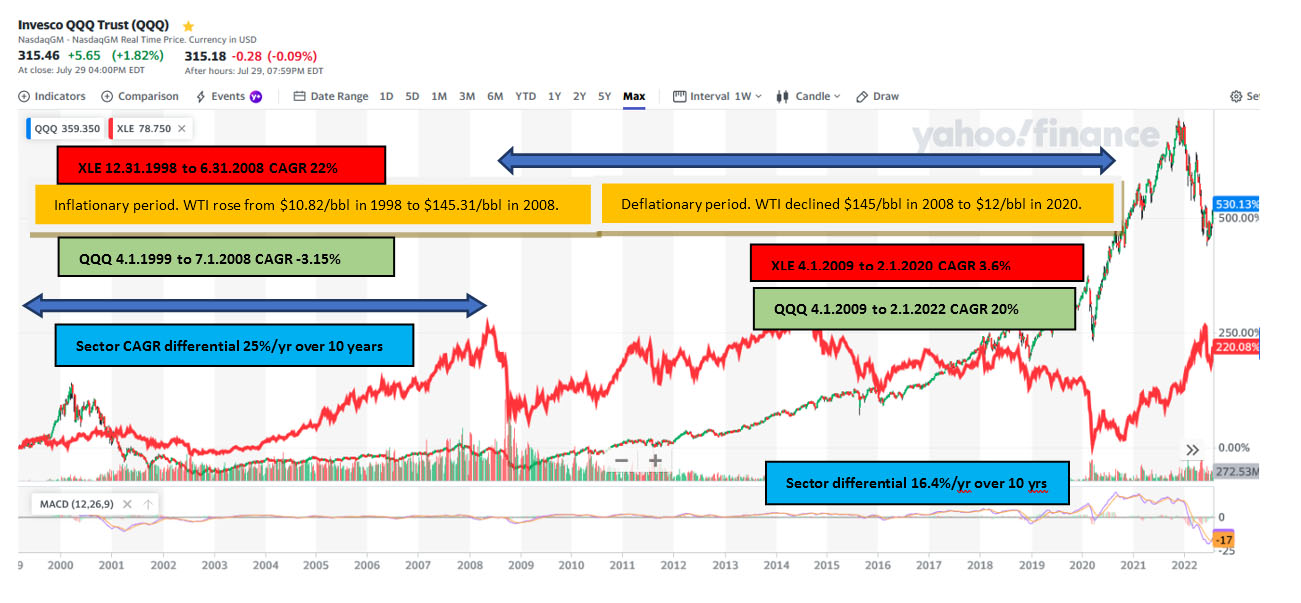
In the chart below, we compared the Energy Select Sector Spider Fund (XLE) as a proxy for inflation and the Invesco (QQQ) Trust which tracks the NASDAQ 100 as a proxy for deflation. The performance differential is stunning when you apply them to the inflationary and deflationary sectors delineated below. If past is prologue, we believe we could see tremendous investment returns into 2030 and those who stick to asset allocation policies of the last decade or forty years, will significantly underperform.
Stock prices track earnings. The chart of earnings below from Factset courtesy of Jeffrey Huge CMT shows how skewed earnings have become leaving energy as the stand out earnings generator compared to the rest of the market.
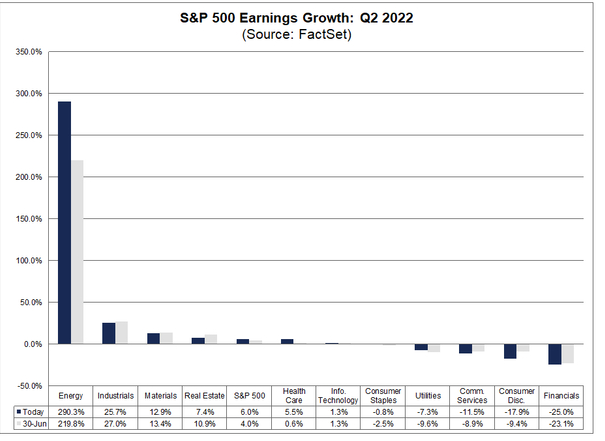
This skew is only re-enforced by the fact that the energy share of the S&P 500 has declined from 20% to 2% and now is 5%. Still energy is 5% of the S&P 500 with 9% of its earnings. Markets tend to follow earnings trends, and energy is the earnings leader. Technology no longer is leading. These fundamental facts support the great rotation from growth to value.
We completely agree with Jeff Huge, CMT who wrote: “With 56% of the companies that comprise the S&P 500 having reported 2Q22 results through Friday’s close, including the big-six: TSLA, MSFT, GOOG, META, AAPL, and AMZN, we now have a pretty good feel for how EPS growth will look for the quarter – and it’s not great!”
Energy, as measured by the XLE energy ETF rose 250% from the March 20, 2020 low before pulling back 30% between June 6 and July 11. We view this as an attractive entry point for energy.
The Impossible Physics of The Green New Deal:
We question the Green Transition’s physics. That is, while we all hope for a clean environment, a decarbonized earth, stopping climate change, and Net Zero by 2050, we don’t believe the transition will be as easy as was suggested by John Kerry in the beginning of the Biden Administration. Our view has been reaffirmed by the energy policy disaster playing out in Germany and Europe, based on the naive view that you can add solar and wind and replace fossil fuels without deadly consequence. The choice is either we can die today from a lack of energy and food due to policy mismanagement or die in 40 years when the world will come to an end due to the feared climate disaster from using fossil fuels.
The two YouTube Videos by Mark Mills below make the same point. 84% of the world’s baseload energy comes from fossil fuels. 10% of energy comes from nuclear and 5% from renewables. To quickly convert that much baseload energy into wind and solar by stopping domestic energy production is impossible as argued by Mark Mills, a physicist with the Manhattan Institute.
https://youtu.be/j8grM3DXnX0 “Unobtainium”
https://youtu.be/wDOI-uLvTnY “How Much Energy will the World Need?”
Both Income Growth Advisors, LLC and Optima Process Systems, Inc., where the author is a principal, have researched the world’s energy transition toward UN Sustainability Goals. We believe that Mark Mills is right and the policies that Europe and the US have adopted are not working. Energy prices are soaring and these uber green policies have allowed Russia’s Vladimir Putin to use Russia’s natural gas as a strategic weapon in its war on Ukraine. This is leading to a horrific war, death, food shortages, and enormous economic costs in the name of a green transition.
We have a couple salient takeaways. The development of natural gas, LNG and nuclear energy are critical pathways to a lower carbon environment. Natural gas, LNG and nuclear will allow for the needed baseload energy to moderate energy prices meaningfully, though these pathways are repugnant to green activists. The scary dirty secret is that it is necessary to burn coal now to generate electricity to avoid blackouts in both Europe and the United States. Further, the dirty world of mining will need to ramp up considerably to create the needed minerals to build the green infrastructure to bring about a clean sustainable energy future.
We believe it is in the identification and investment in the bone fide energy solutions for tomorrow that great growth opportunities will define the next few decades. Unfortunately, the solution will not be from “unobtainium” but from “all of the above.”
Gold and Precious Metals Poised to Lead:
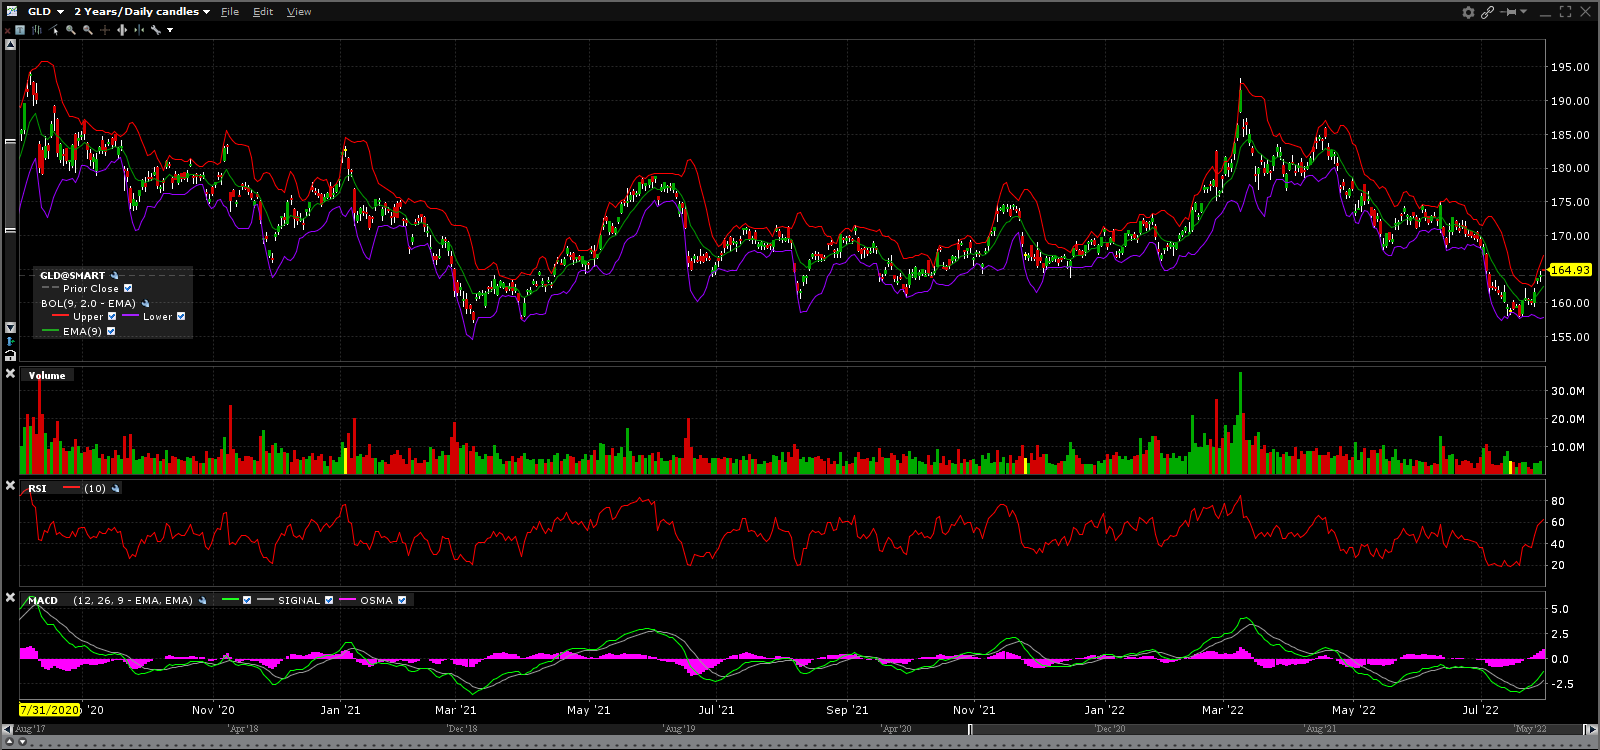
Across the board assets are losing value, but gold has largely been a bystander during the irrational exuberance of recent years. With the Fed’s second tightening of 75 basis points last week, the Fed has hit an inflection point where short term US Treasuries are losing their leadership appeal to international money as the safest place in the world for big safe investment. This anticipated deceleration in Federal Reserve tightening will lead to the dollar losing its upward momentum and gold and precious metals will start to rally in what could be a major multi-year bull market.
This shift in sentiment regarding gold is shown in the two year chart of gold below, and its recent uptick since the Fed meeting on July 27 and 28th.
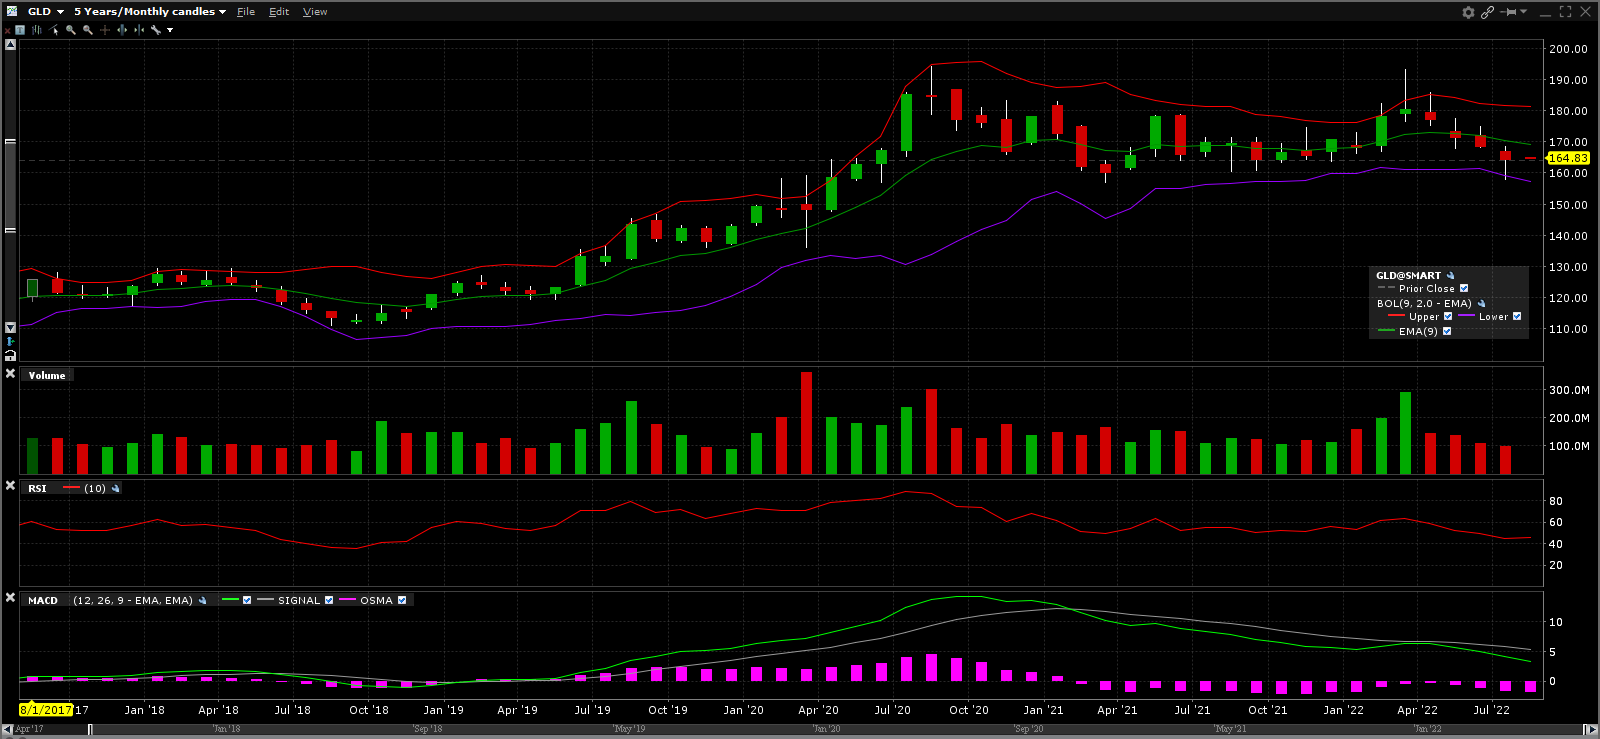
On a longer term basis we believe gold can move much higher, consistent with John Paulson’s view that compared to the Great Financial Crisis where much of the Fed accommodation went to rebuild bank balance sheets, the COVID-19 Crisis will lead to a surge in gold prices.
Conclusion:
Global economies are experiencing a major spike in inflation. Historic precedent and fundamental factors lead us to expect we are in an inflationary cycle which will last until 2030. The investment winners of the past 40 years, during which time interest rates declined dramatically, and the recent deflationary cycle winners since 2009 such as growth stocks, tech stocks, FAANG stocks, the S&P 500 and bond investments will no longer provide their attractive historical returns due to inflation.
Because of inflation, an inflationary cycle has commenced where many popular investments and strategies that provided superior returns in the past will now underperform. Unfortunately, institutional bias and “market memory” will keep the investing public invested in past leaders and backward looking investment strategies. Consequently, those investors will experience lackluster success or failure in the years ahead. Because of herd mentality and an unwillingness to incorporate the fundamental impact of inflation on asset pricing, security selection, and investment strategy, a tough road lies ahead for timid backward looking investors.