Market cycles repeat themselves and we believe this current stock market cycle parallels the 2000 technology bubble because today’s market is led by technology stocks, enjoys a positive financial feedback loop, and is experiencing a mass euphoria. Furthermore, today’s market bubble benefited from four decades of declining interest rates, which lifted equity valuations, drove decades of exceptional returns, and created unrealistic return expectations for popular US indices, mega cap stocks, and real estate.
We believe we are at the end of this positive feedback loop driven by a crack in the AI bubble, the rise in inflation, and growing recessionary fears. In the weeks and months ahead, we expect that there will be an increasingly pronounced rotation away from large capitalization technology stocks and greater investment in sectors which have been overlooked for years including gold, small capitalization and value stocks as well as emerging markets like China.
The US Technology and Stock Market Bubble:
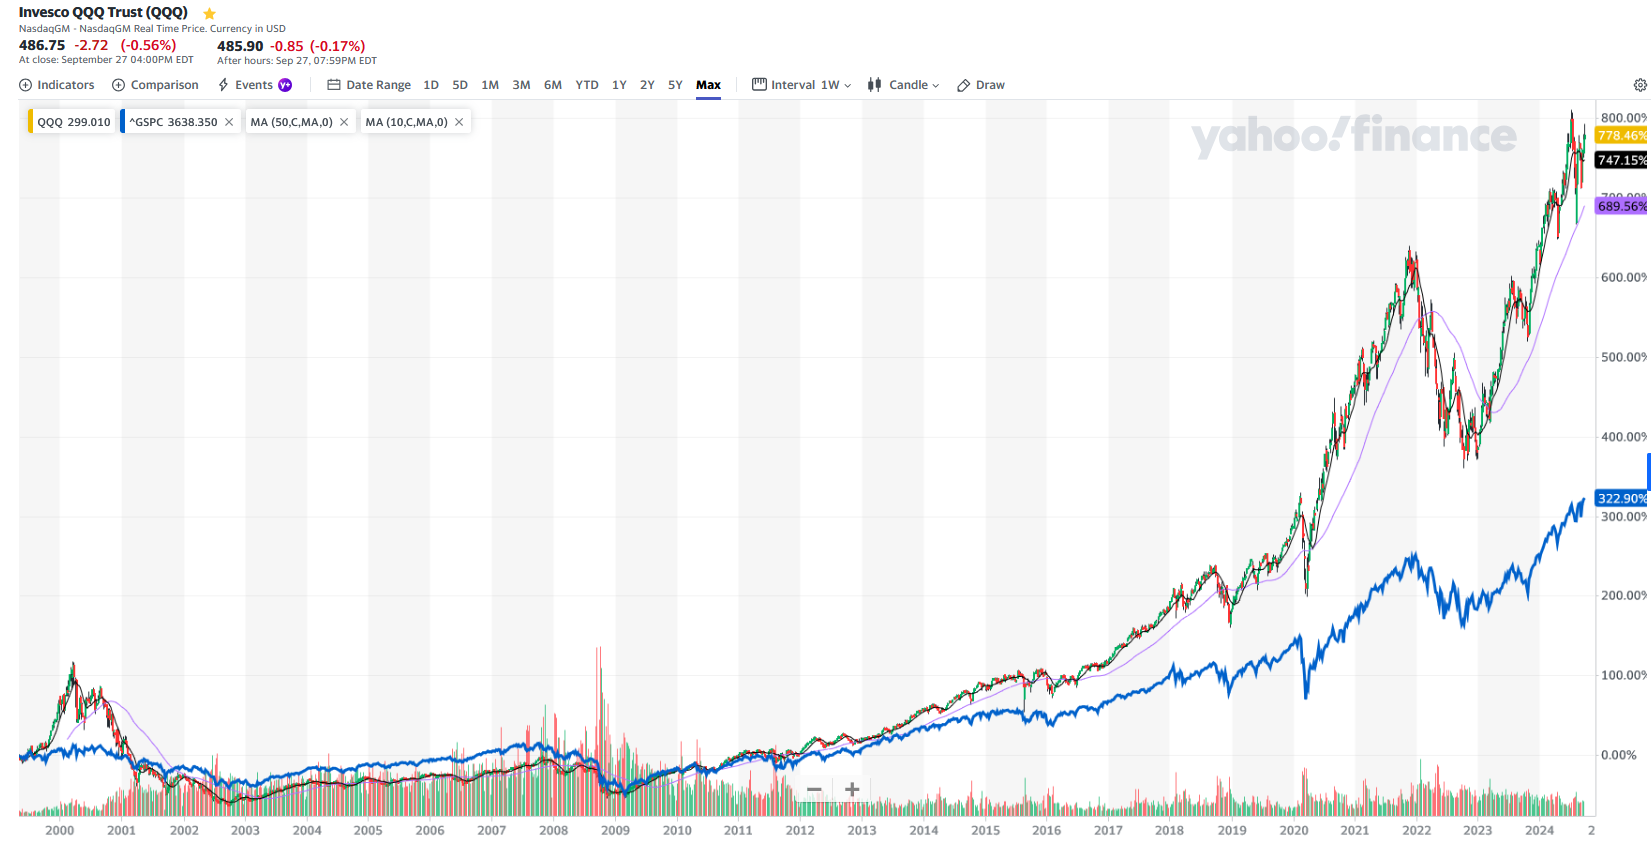
The charts below of the S&P 500 and the NASDAQ 100 (QQQ) show the telltale parabolic rise of the NASDAQ 100 from March of 1999 into March 2000. A similarly unsustainable 93% rise in the NASDAQ 100 index occurred from December of 2022 to July 2024 driven by AI mania, ChatGPT, Nvidia, and the Magnificent 7 stocks. We believe that the market leadership rotation following the 2000 market bubble will be similarly reproduced in the months and years ahead.
One of the key drivers for US equities since 1981 has been a steady decline in interest rates shown in the chart below. The 10-year US Treasury bond yield declined from 15.85% in September 1981 to 0.55% in August 2020. Declining rates drove higher and higher valuations which drove a generation of equity and real estate investors to believe that stock and real estate investing are perennial safe bets, though the history of market cycles tells us otherwise.

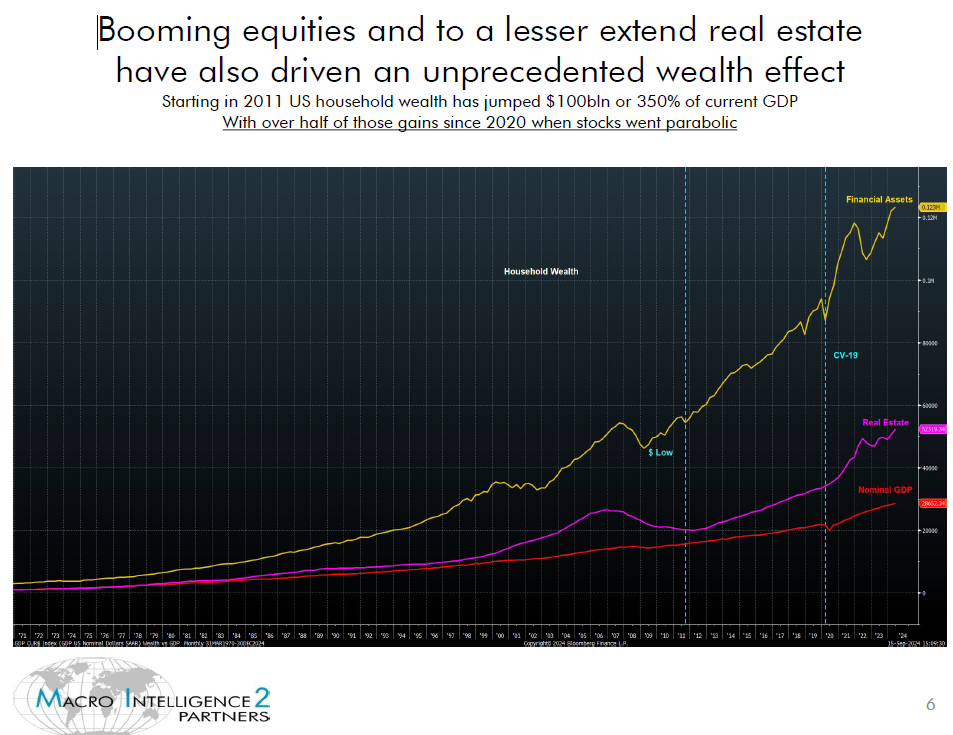
The chart below by Macro Intelligence 2, LLC’s Julian Bridgen shows how much US household wealth has grown in recent decades and, more importantly, how much financial and real estate assets have grown relative to US GDP. Man is a herd animal and investors follow trends until those trends reverse. Market history shows that when market bubbles burst, it takes years until those assets again enjoy above average returns.
Warren Buffett’s so called favorite indicator compares the value of the Russell 5000 to the Gross Domestic Product. The chart below shows that US stock market valuations are at extremes and, should market and economic factors turn negative, a significant decline in the stock market could ensue.
One factor that could drive the US equity markets into a bear market would be an economic recession. Recent signs of slowing economic activity, notably rising unemployment, are signaling that the economy’s growth rate is slowing while markets and the Federal Reserve are seeing signs of lower inflation. The market is at a critical point where slowing economic growth is likely contributing to reduced concerns about inflation, but the economy may in fact be headed toward a recession and markets have not begun to price in such a downside risk.
The chart below of the Federal Reserve Risk Premium Model has dependably shown that when the red S&P 500 earnings line turns down, the blue S&P 500 experiences bear markets e.g. 2000-2003, 2007-2009, and 2020.
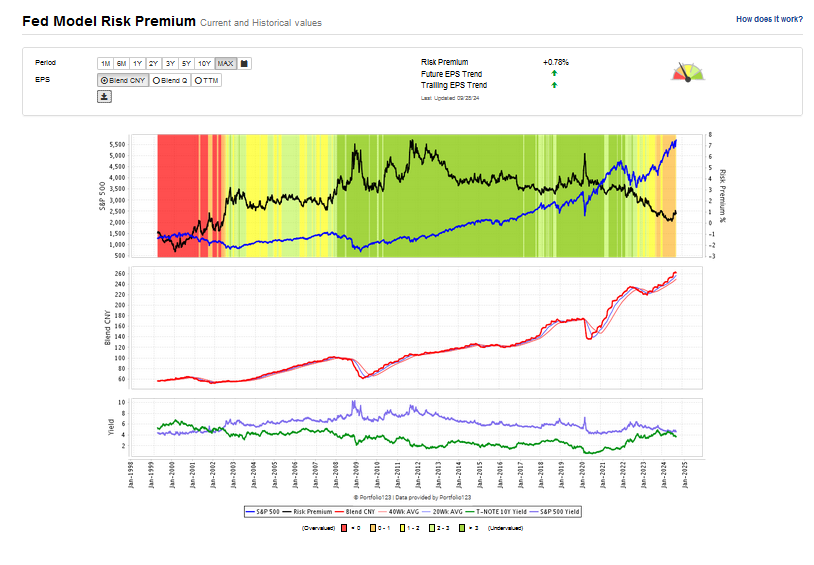
The data set below shows that the US market was at peak risk around July 7 when the risk premium was 0.17 and 10-year US Treasury yields traded with a “four (%) handle”. In August, earnings stopped rising but yields on the 10-year US Treasury dropped into the 3% range and the risk premium rose to 1.17% around September 7th. As we head into October, earnings will be critically important to track as most investors are hoping for a soft landing, but the risk of a hard landing is a real probability. If earnings decline in the coming weeks and the risk premium continues to decline to zero, defensive actions would be prudent especially for those with large equity allocations.

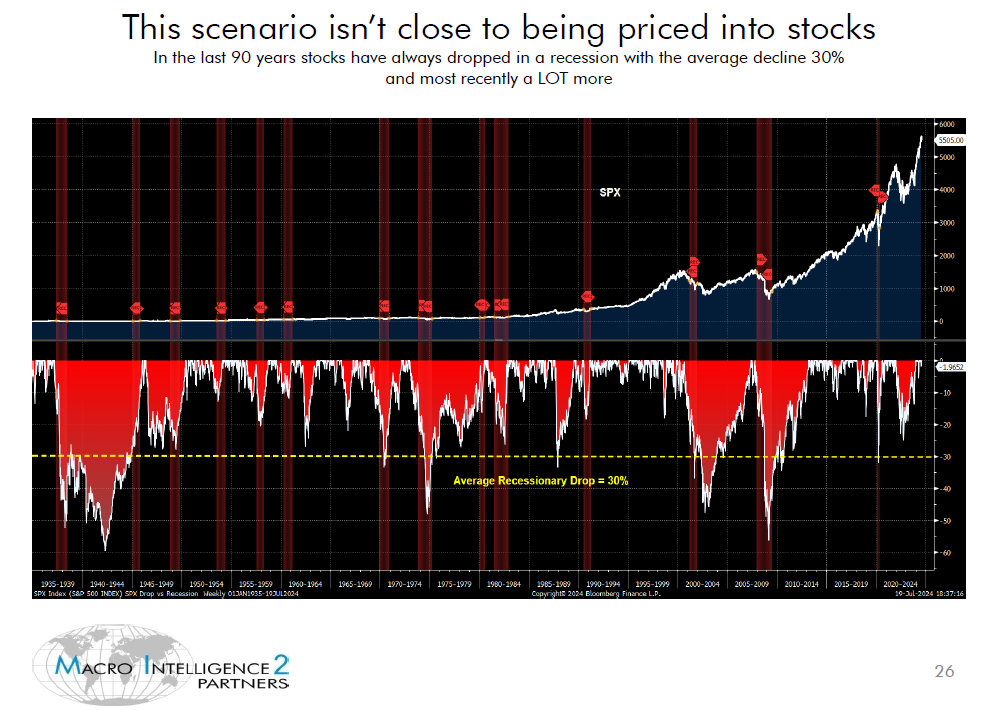
Julian Brigden shows in the chart below that when the economy enters a recession, the odds of a 30% stock market grows. The coming weeks could quickly show if the S&P 500 earnings are turning south, if earnings reports start forecasting a recession. If earnings start turning down, then the logic of our continued allocation away from the 60/40 asset allocation model, capitalization weighted indices like the S&P 500 and NASDAQ 100, mega cap growth, and technology should pay off handsomely.
New Themes:
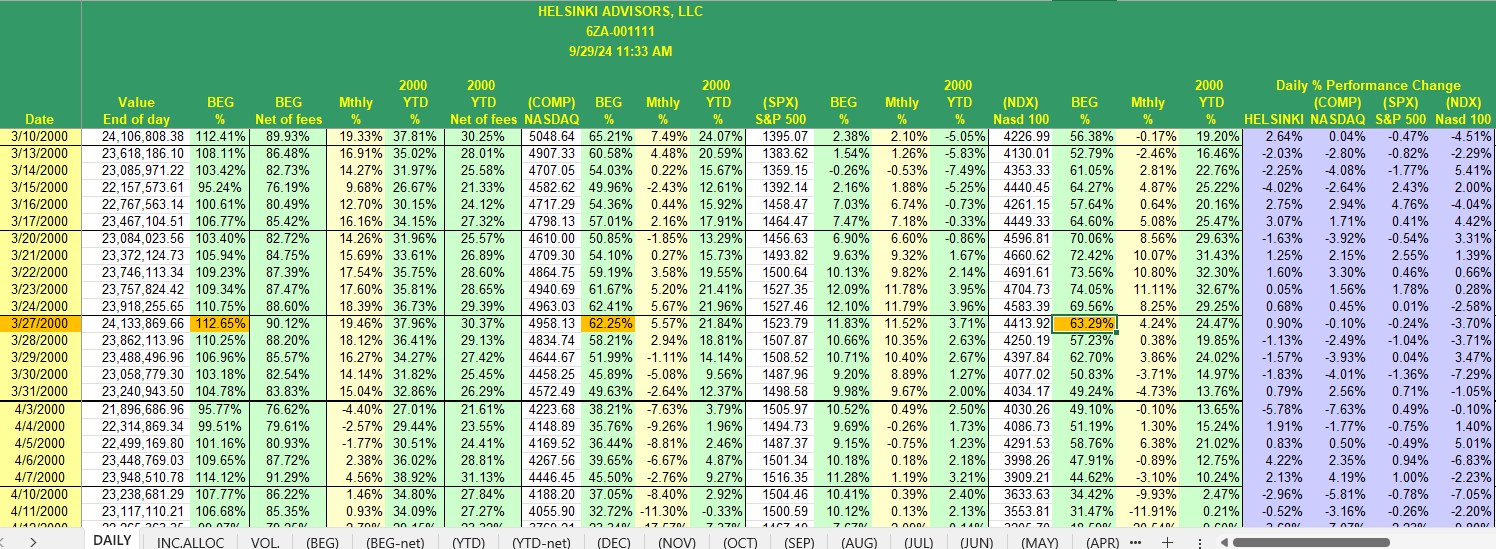
In late 1999, I managed a top performing technology hedge fund, Helsinki Advisors, LLC, and reduced our tech exposure at the market peak. While our timing in the short term up over 100% in five months was exhilarating, the benefit of hindsight in the wake of the technology bubble was the real source of valuable market insight. Namely, in the wake of the tech bubble, rotating away from large cap technology stocks for a decade and reallocating to new unpopular markets in other sectors, geographies, and asset classes was critical to successful portfolio and wealth management. The chart below shows our five month 112% gross rise in Helsinki Advisors, LLC. It wasn’t until 2004 that I first read Robert Shiller’s Irrational Exuberance, the classic study of market cycles and behavioral economics.
Specifically, what our hindsight and Robert Shiller taught us was that by investing in small cap and value stocks, emerging and international equities, commodities and commodity stocks, provided sources of new ten fold leadership while past leaders stalled for a decade. This was especially true in the performance of investments like gold, oil, and China.
Bridgen shows the geographical benefit of investing internationally in the chart below where emerging markets rose 200% from 2002 to 2008 relative to the paltry 10% return delivered by the US MSCI index.

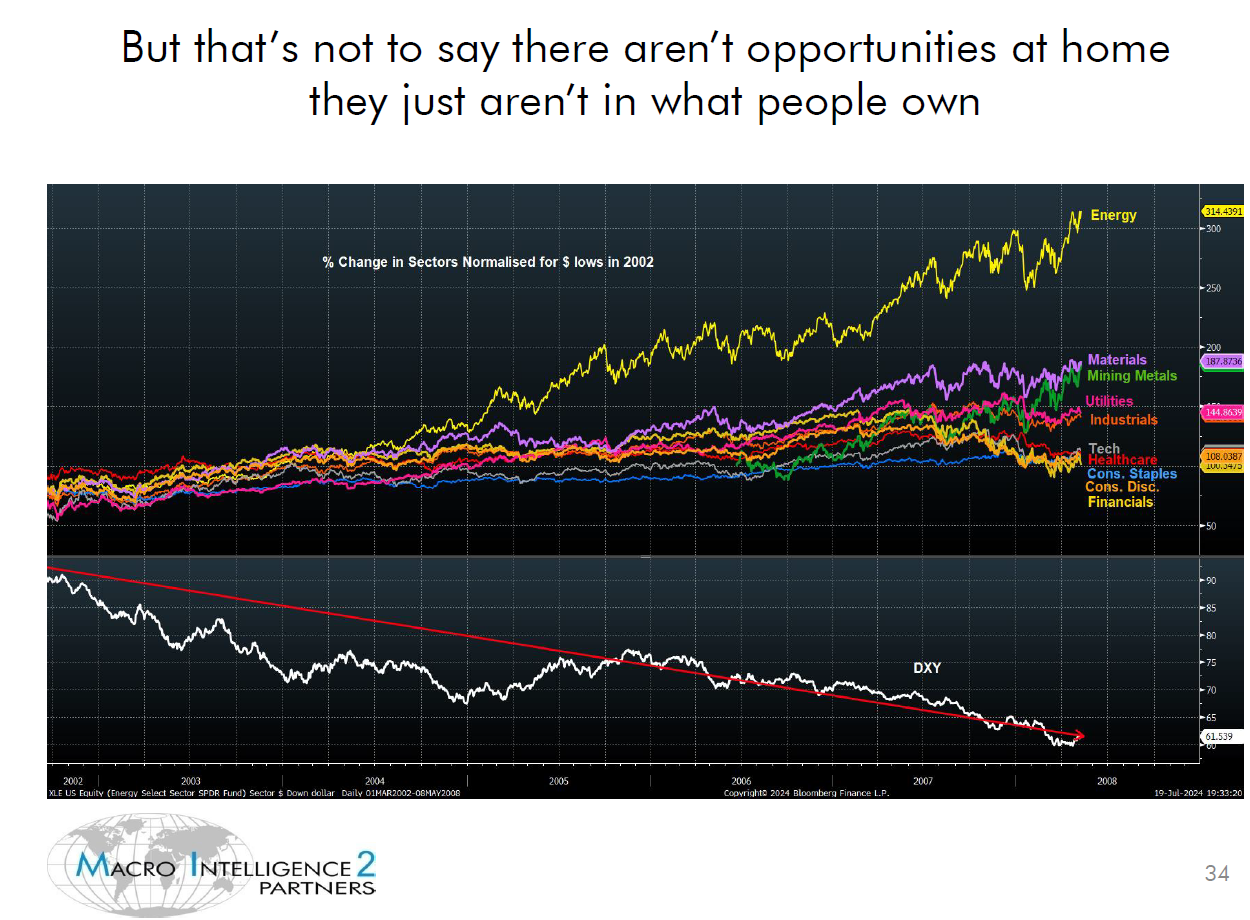
Additionally, Brigden shows that the energy, materials, and mining metals significantly outperformed technology, and a rotation into these new sectors would have led to stellar investment returns.
Recency Bias: Trapped in Technology
Recency bias is the psychological phenomenon that keeps one believing that recent investment history is an accurate indicator of future investment prospects. While momentum clearly is a reinforcing trend driver in the investment world, recency bias is as logical as driving by looking in the rear view mirror. Most investors want to gravitate toward what has worked, like Nvidia, the Magnificent 7, the NASDAQ 100, when diversifying into new sectors, assets, and geographies will likely be more rewarding because new out of favor investments will provide low cost entry points from which high long term returns are most achievable.
Inflation Cycle:
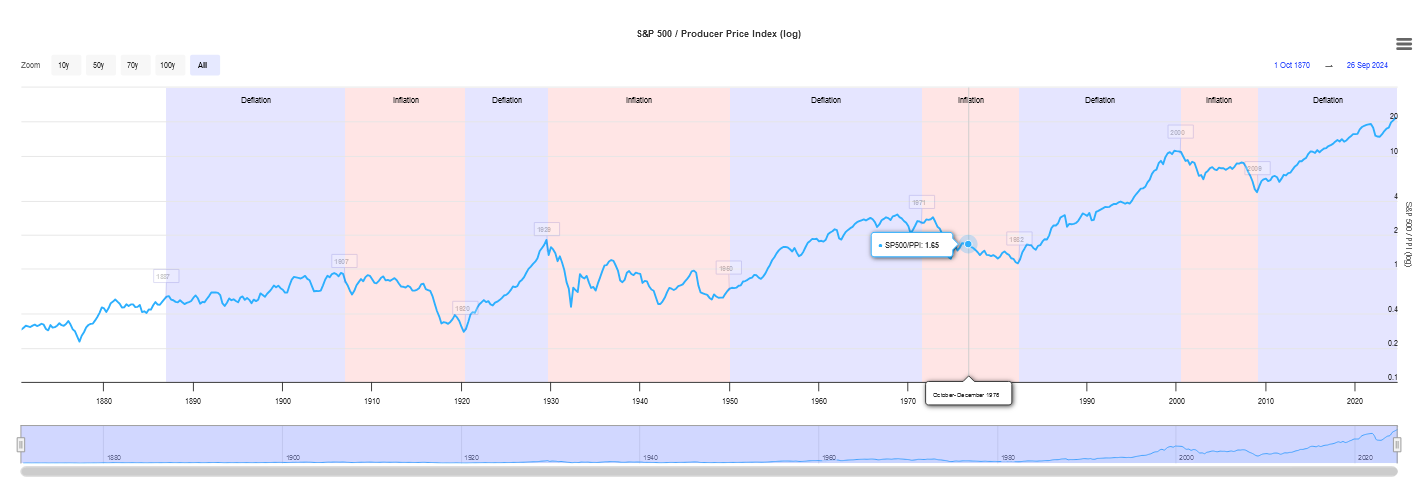
Since 2001, we have seen the consumer price index rise to 9.0% from 1.4%, and this wave of inflation augments our belief that we are now in an inflationary cycle which will benefit commodities, miners, and gold. The chart below shows the ratio of the S&P 500 index divided by the producer price index. Following major market bubbles in 1929, 1969, 2000, and today, inflationary cycles have commenced leading to meaningful return performance in energy and precious metals. The recent wave of inflation should drive new bull markets in industries where demand outstrips supply. Recent central bank investments in gold are a prime example of demand driving interest in gold and gold mining stocks.
Signs of the Great Rotation:
In November 2019, the price of gold was $1458/oz. The chart below shows that gold today is $2637/oz, 80% higher. Since February 2024, gold has broken to new highs, above the $2000/ounce level, and is up 28.8% this year to date. Higher gold prices arithmetically drive higher gold miner gross margins, which gives gold stock investors rare but definitively forward earnings guidance on gold miners. We see some extraordinarily deep value in junior gold miners.

This Summer’s Russell Rally:
In July, the iShares Russell 1000 Value ETF broke out, around the time we wrote “Final Stages of Mega Cap Blowoff” on Seeking Alpha and stated that Nvidia Corporation shares have “all the markings of a generational stock market peak like 1929….” We believe the rally in the IWD value index ETF meshes with our rotational thesis away from mega cap growth. The chart below shows IWD rallying from early July and outperforming NVDA, the Magnificent 7, and the NASDAQ 100 which are losing their upward momentum.

The China Stock Market Rally:
China has been an underperforming market for four years. The country has increasingly fallen out of political favor, and its equity and real estate markets have been in bear markets which only recently reversed.
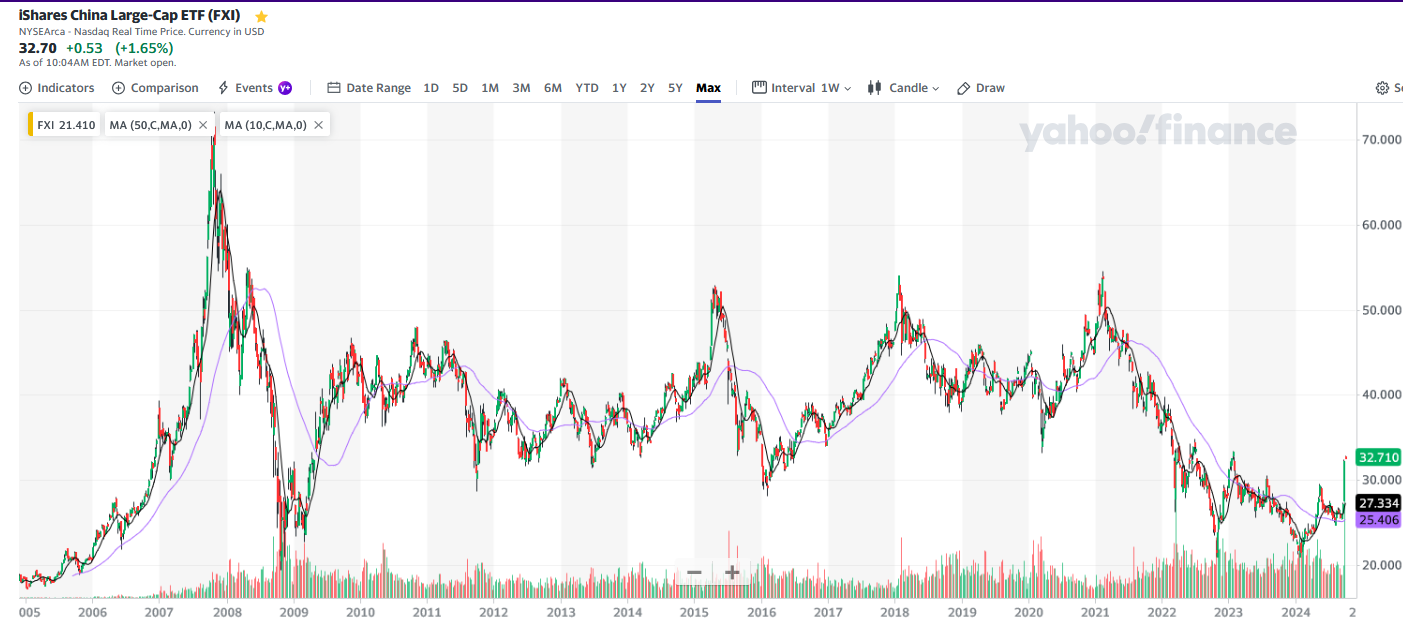
China’s CAPE ratio is 13.2 versus the US CAPE ratio of 31.12 as of June 30, 2024. Signs of increased discussion with China’s military, and last week’s massive monetary stimulus, have helped to drive significant strength in the Chinese equity markets.
On our September 12th zoom call, we had a compelling conversation on investing in China with recommendations of BYD Company LTD (BYDDY), Daqo New Energy Corp. (DQ), Weibo Corporation (WB) and PDD Holdings (PDD) all up 16%, 28%, 36% and 39% respectively from September 12th through September 29th.
While there are many reasons to not like Chinese stocks, there are some great companies like Pinduouo (PDD) – “the Chinese Amazon” – trading at six times earnings with world class investors like Ron Barron giving us confidence. Likewise, BYD Company LTD – “the Chinese Tesla” – with its $10,000 Seagull EV and investors like Warren Buffett making this company look compelling.
Conclusion:
Market cycles repeat themselves and the study of past market cycles can provide valuable insight into the future. We believe that today’s US equity market parallels the US Technology Bubble of 2000. We believe the most valuable observation of the 2000 market peak is that parabolic stock market moves are unsustainable, signal generational market peaks, and commence a profound shift in leadership.
During the 2000 to 2009 inflationary period, the S&P 500 was relatively flat but gold, oil and China all experienced near ten-fold moves. When faced with the rich valuations of US markets and the increasingly ebullient moves in gold, small cap value, and Chinese stocks, we believe that continued allocations away from traditional investments like market cap weighted indexes, like the S&P 500 and NASDAQ 100, mega caps stocks, like the Magnificent 7, and into cheap dormant investments like emerging markets and precious metals could prove not only defensive, but potentially quite lucrative in the years ahead.