
The Inflation Cycle Provides Clarity
They say history repeats itself. Philosopher George Santayana warns us that “Those who cannot remember the past are condemned to repeat it.” We know that man is a herd animal who is susceptible to mass delusions. We have seen cycles like market bubbles dating back to the Dutch Tulip bubble of 1637. These cycles have been chronicled and studied by many including Charles Kindleberger’s Manias, Panics, and Crashes: A History of Financial Crises and Nobel Laureate, Robert Shiller’s Irrational Exuberance. Common with bubbles is the sense that “this time is different”, but cycles can be larger than market bubbles and can relate to empires, civilizations, and economies. Currently most are concerned about a bubble in Artificial Intelligence or the technology sector; however, we see tangible investment opportunities and asset allocation benefits from studying the inflationary cycle and using valuation analysis.
Robert Shiller’s Cyclically Adjusted Price Earnings (CAPE) chart below provides two valuation warnings. Firstly, we are in a rising equity valuation cycle closing in on historic highs. Secondly, long-term interest rates like 10-year US Treasury yields have risen sharply from their 2020 0.55% lows but could rise to 6-8% before this cycle breaks.

Conventional asset allocation theory suggests a 60% equity 40% bond strategy; however, we believe that allocation is now obsolete. When the Modern Portfolio theory was developed by Nobel Laureates, William F. Sharpe and Harry Markowitz, in the late 1970s, the valuation argument for owning 60% S&P 500 and 40% 10-year US Treasuries was compelling. But that valuation argument is not wise today. The databox below shows that in the early 1980s, the CAPE (Cyclically Adjusted Price Earnings) ratio for the S&P 500 was in the 7-9 range compared to today’s 41 CAPE.

The S&P 500 today is five times more expensive than it was in the early 1980s. Furthermore, 10-year US Treasury yields were between 10-15% (Long Interest Rate GS10) in the early 1980s and then they were AAA rated by all the credit rating agencies. In the early 1980’s, a balanced portfolio of 10-year US Treasuries and the S&P 500 could have easily returned 15% on an annualized basis for several years.
Given the United States’ strained financial system, our capacity to continue to service our debt has become a serious public discussion. This discussion is highlighted by Ray Dalio’s recent recommendation that investors sell bonds and allocate 15% to gold; Treasury Secretary Scott Bessent’s attempt to lower longer term treasury rates by buying long-term Treasuries and financing them with short rates; and Stanley Druckenmiller’s August 24th Wall Street Journal OP ED where he admonished his former protégé Scott Bessent for trying to manipulate the market.
Ray Dalio summed up today’s global financial problem “First, debt service payments grow relative to incomes until they crowd out spending. Think of credit as being like blood in the economy’s circulatory system. When credit circulates well and is used productively, it generates income that can service the debt that created it, which is healthy. But when debt service grows faster than the income needed to pay for it, debt-service costs accumulate like plaque in arteries, gradually crowding out other spending until eventually there is a financial heart attack. That is now happening in the U.S., but the U.S. isn’t alone. The United Kingdom, the European Union, China, and Japan all face too much debt relative to income and fiscal imbalances their governments haven’t solved.”
Ray Dalio’s book How Countries Go Broke: The Big Debt Cycle and recent analysis suggest that we are heading into a financial crisis. Consequently, we believe that owning long-term US Treasury bonds is a flawed idea due to both interest rate risk and credit quality risk not being well compensated for. Owning 15% gold and other hard asset plays are attractive investment options where tangible outperformance can be found. There is compelling evidence that a shift toward commodities is underway and select opportunities should be embraced.
The chart below of the 10-year US Treasury yield shows that bond yields could be near a peak and success with Iran could lead to a rapid decline in long term interest rates. Unfortunately, how this conflict unfolds is geopolitical speculation.
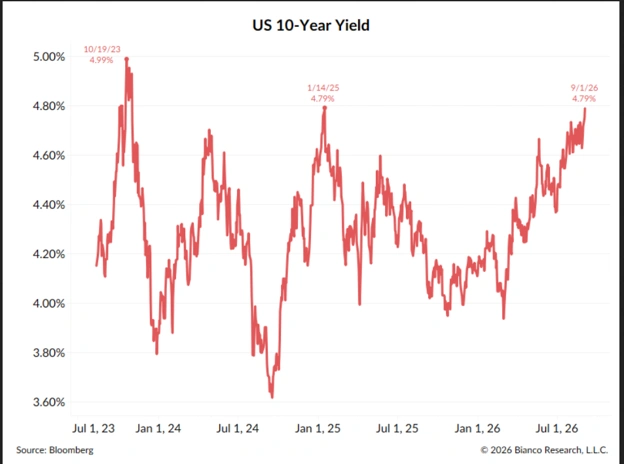
Source: https://offthecharts.substack.com/?utm_source=substack&utm_medium=email
Inflation Cycle:
The stock to commodities ratio chart below shows the 160-year cyclical nature of inflationary and deflationary cycles. During inflationary periods like the 1970s and the 2000 to 2009 period, we have observed commodities, emerging markets, international markets, small capitalization stocks, value stocks, precious metals, and energy all performed far better than the S&P 500. Furthermore, during inflationary periods, dollar weakness can lift the valuations of international and emerging market investments.
We have entered this new cycle for three reasons:
- 10-year US Treasury yields bottomed in July 2000 at 0.55%,
- inflation soared during the Biden Administration due to COVID and profligate spending,
- and commodities like gold and oil bottomed out in 2020 and have shown impressive returns since.

The charts below suggest several areas where we see breakouts and strength that appear durable. The chart below by Callum Thomas of Topdowncharts@substack.com suggests that the dollar is poised to break lower in the coming months. Due to the weakening financial stability of the US financial system, we anticipate the dollar to weaken.
Dollar Weakness:

When we combine the investment logic of owning foreign or emerging market stocks with their low valuations, the case for owning Latin America versus the United States is compelling.

Tavi Costa and Income Growth Advisors, LLC believe that Chile, Brazil, and Argentina are countries that can provide attractive upside and diversification away from the S&P 500.
The chart below by Costa shows how overweighed Asia is compared to Latin America in the MSCI Index Weightings.
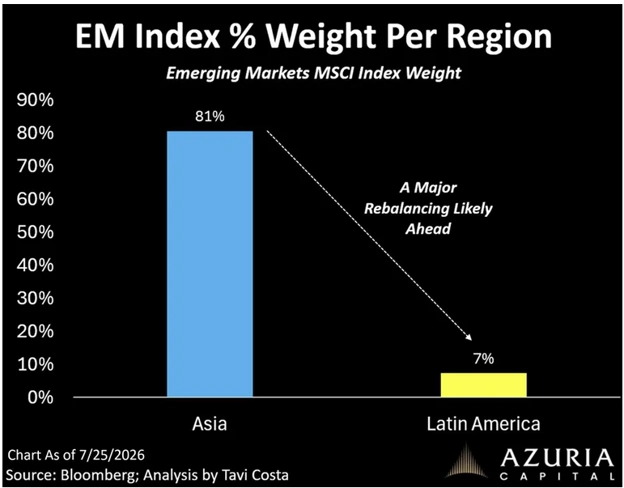
There following charts are from Tavi Costa, formerly with Crescat Capital and now Azuria Capital. He believes, as we do, that there is a commodity cycle playing out today and this cycle could easily last ten years.
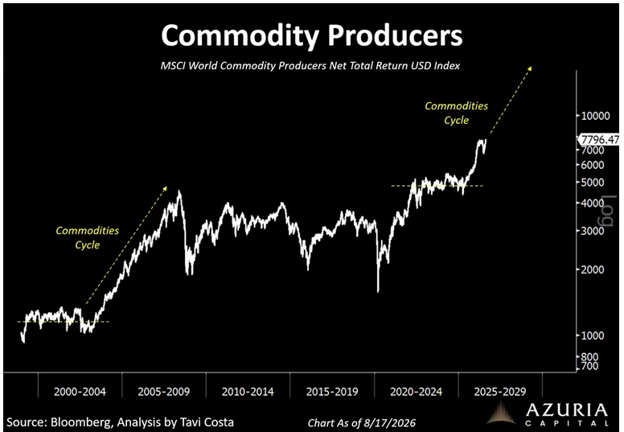
Agricultural Commodities:
Agricultural commodities are breaking out. With persistent, elevated energy prices, we expect agricultural commodities to remain strong. Additionally, the wars in Ukraine and Iran have exacerbated shortages that can push agricultural product prices higher.
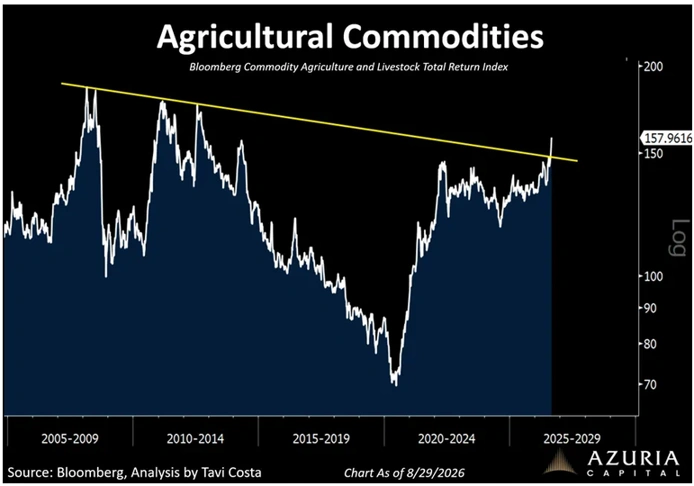
Costa likes the INVESCO DB Agricultural Fund (DBA) commodity index contracts that invest in corn, soybeans, wheat, sugar, cocoa, coffee, cotton, cattle and hogs. The ETF is up 14.38% y-t-d and yields 3.32%.
The chart below shows that reported inflation is lower than the “real world” or actual inflation experienced by consumers.

Gold is proving to be an especially attractive commodity due to the debasement trade and foreign central banks are buying more gold today than US Treasuries. This trend of foreign central banks buying more gold than US Treasuries should persist until meaningful fiscal reform is implemented. The prospect of fiscal conservatism is politically unpopular and, consequently, unlikely to reverse in the near term. Foreign central bank buying is a major factor driving the price of gold higher and it will likely persist until there is a financial reset following a financial crisis in the coming years.
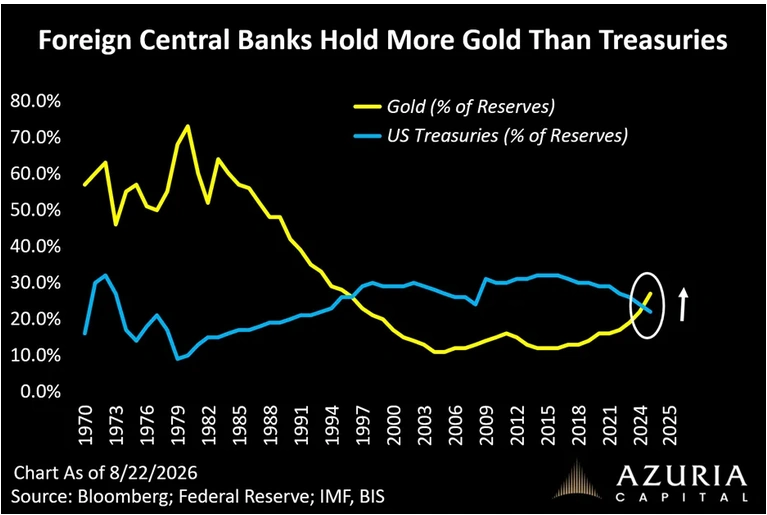
We are noting investment professionals are now suggesting much higher gold prices that, heretofore, would have been considered laughable. We don’t know how to assess the upside tail risk well, but here are a few notable gold price targets: billionaire gold investor Pierre Lassonde $17,250/ounce, Crescat Capital $20,000/ounce, Jim Rickards and Ed Yardeni $10,000/ounce. Gold mining stocks are cheap and have attractive earnings growth momentum, which when combined with the potential upside tail risk offer compelling return profiles.
The chart below of the ratio of above ground gold to global equity market capitalization suggests the potential upside of gold, and by extension, gold miners is significant and timely.

Gold is not the only precious metal that is performing well. Silver is also breaking out and, historically, can experience more dramatic runs than gold during a precious metal bull market. The chart below of silver is breaking above its downtrend line and suggests that a bottom is forming in silver and a move higher in silver prices is likely.

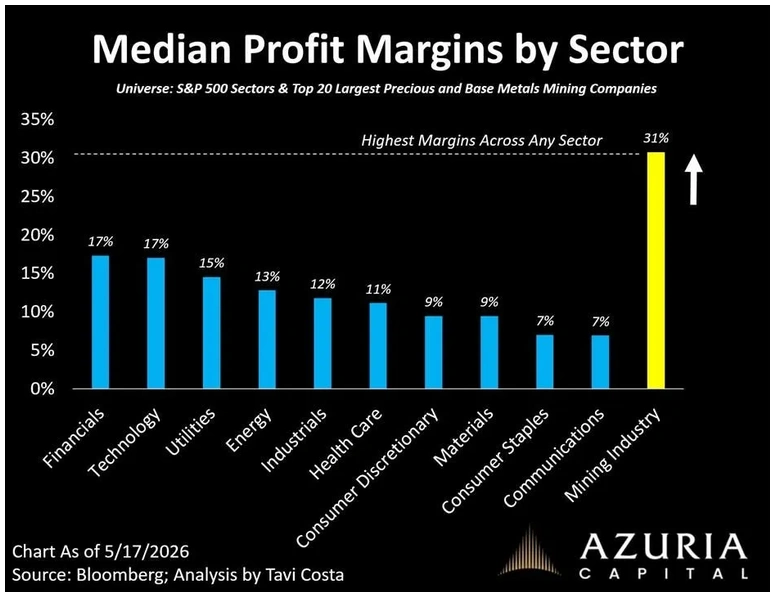
While commodities are not a typical investment for the average investor, owning a company that benefits from a rising commodity price and generates earnings and cash flow can be a shrewd investment opportunity. Gold mining stocks have been enjoying strong performances in recent years. We prefer owning precious metals miners over precious metals for their cash flows and liquidity. While gold mining shares have been on a tear in recent years. Sophisticated investors are buying individual gold miners as part of an asset allocation. The chart below shows how profitable gold mining stocks are compared to other sectors.
Conclusion:
We live in dangerous times geopolitically and financially. The inflationary cycle model provides a historic analogue that helps to identify assets, sectors, and geographies which should be considered to provide good risk adjusted returns in the years ahead.
The case for the 60% equity 40% bond allocation is no longer compelling since it was developed and popularized 45 years ago. We see variations around a 25% cash, 25% equities, 25% bonds, and 25% commodities asset allocation as one which offers better value and income than the 60% equity 40% bond allocation.
Today, owning a larger allocation to cash, now that it offers a yield of 3.13% at Interactive Brokers, makes sense in these uncertain times. Not only is the yield with minimal downside, it provides cash for opportunistic or tactical reallocations in the future.
Owning 10-25% bonds that are split between domestic and emerging market or international geographies can enhance yield, add a weak dollar hedge, and provide a sensible reduction from a 40% 10-year US Treasury allocation.
Reducing equity exposure away from the 60% S&P 500 allocation to own more foreign or emerging market equities also reduces valuation risk and provides a dollar weakness benefit. Like the 10-25% emerging market and international bond holdings, 10-25% in emerging market equity holdings is a compelling alternative to the S&P 500 allocation. This foreign equity allocation adds diversification, deep value and a declining dollar benefit.
There are a wide range of equity income investments that provide meaningful dividend income that can provide a solid buffer during an equity downturn. Master Limited Partnerships like Energy Transfer (ET) offer tax-advantaged 6.35% distribution income while benefitting from natural gas infrastructure cashflows. Closed end funds like GAMCO Global Gold, Natural Resources, & Income Trust (GGN) offer a 7.55% yield that is produced through a covered writing strategy which we believe is very safe. More importantly, the portfolio consists of gold stocks and energy stocks and the fund performance historically correlates with the price of gold. Other income vehicles like The JP Morgan Equity Premium Income Fund (JEPI) which yields 7.97% and owns Amazon.com, Inc. (AMZN), Microsoft Corporation (MSFT), and Alphabet Inc. (GOOGL) is another attractive income source that may be a far more defensive equity investment than the S&P 500.
An allocation to commodities and commodity stocks seems highly compelling. Whether it is 15% or 25%, we believe gold and precious metals miners offer compelling return potential with excellent portfolio diversification. Agricultural exposure also appears timely, and DBA could provide diversification, upside potential and a modest dividend.
In the past, we have suggested a 25% cash, 25% equity, 25% bond and 25% commodity allocation as a sensible alternative to the 60% equity 40% bond allocation championed by Sharp and Markowitz, but with today’s inflationary, financially, and geopolitically challenged environment client specific weightings may vary. Since everyone has unique investment objectives and risk tolerances, we are not holding out a specific allocation model to be generally adopted; however, attractive high yielding and inflation hedged portfolios can be easily constructed in today’s highly uncertain environment.