
The war in Ukraine, the decline in gold, strength in the dollar, weakness in emerging markets, and strength outside the Magnificent Seven are events and trends that appear to be at inflection points. These reversing trends support our belief that we are in an environment similar to the post-2000 technology bubble, where investors who fought recency bias and transitioned away from large cap tech, the S&P 500, the NASDAQ 100 and the popular 60 40 stock bond allocation were handsomely rewarded for rotating into investments in the emerging markets, commodities, gold, silver, oil, small capitalization stocks, value stocks, shorting the dollar, investing in China and war.
This shifting momentum is captured in the chart set below by Oppenheimer’s Ari Wald.

Another inflection point is the resumption in the rise in the 10 and 30-year US treasury yield. Rising rates represent potentially significant equity market risk if rates don’t stabilize or reverse.
Below is a chart of the 10-year US Treasury yield which, after breaking a 38-year decline in rates from 15.84% in September 1981 to 0.55% in July 2020, began rising as we entered a new inflationary cycle. The 10-year yield after peaking near 5% in 2024, appears to be rising again. The thirty-year yield has broken 5% and is now moving higher triggering a warning sign Stanley Druckenmiller cautioned earlier this year that would signal debt service costs spiraling higher and further undermining our credit worthiness globally.

The likely trend in yields will be decided by how the Iran conflict and war in Ukraine play out in the months and quarters ahead. It cannot be overstated how important the transition to drone warfare and modern asymmetric munitions are changing Ukraine’s recent gains against Russia’s war on Ukraine, but Iran’s ability to interfere with world oil prices via its attacks in the Strait of Hormuz and its Gulf Partners. While predicting military outcomes is highly speculative, an effective peace-through-strength outcome with Iran, not only could usher in lower oil prices and lower inflation. Those lower oil prices could economically cripple Russia, which is losing military momentum to Ukraine. This could lead to peace in Ukraine and further lower energy prices as Russia has massive energy resources which could re-enter the global markets in a future negotiated peace.
With US midterm elections in November, Trump’s success or failure to secure peace in the Middle East will have massive political and geopolitical implications over the coming months and years. Lower energy prices would trigger lower yields and a weaker dollar, which in turn should drive gold prices higher.
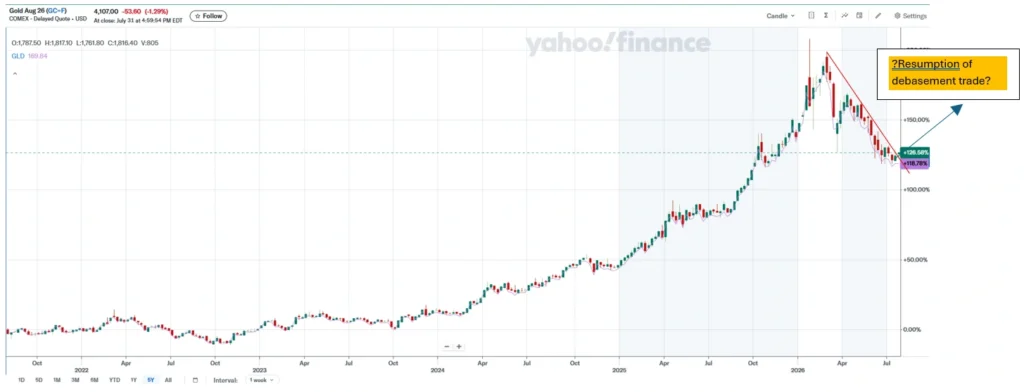
The chart below shows the dollar’s rise since 2015 and its recent further strength associated with higher Treasury yields associated the Iran conflict. This momentum is now slowing and may signal the bottom in the gold market’s mid-cycle pullback that Stanley Druckenmiller and Income Growth Advisors, LLC have been saying is normal for energy linked geopolitical events since 1971.
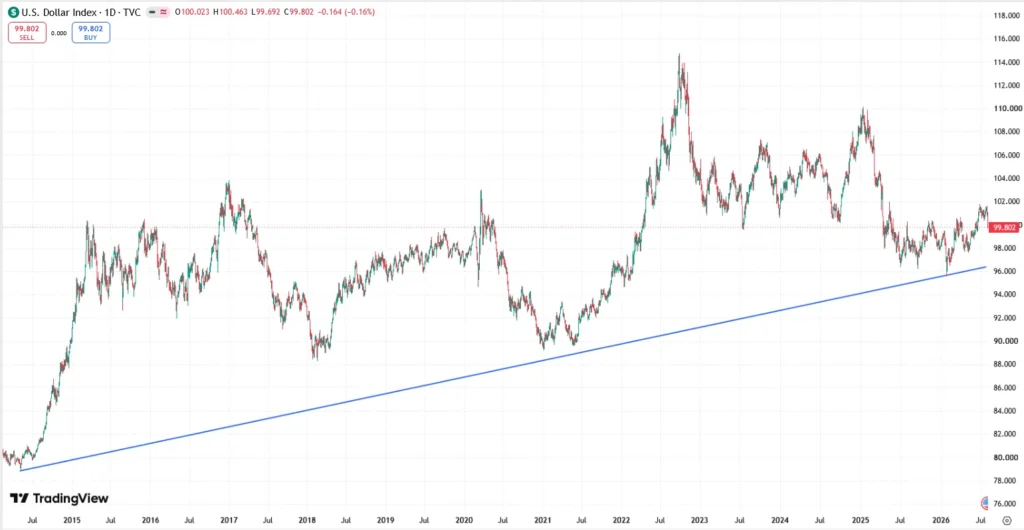
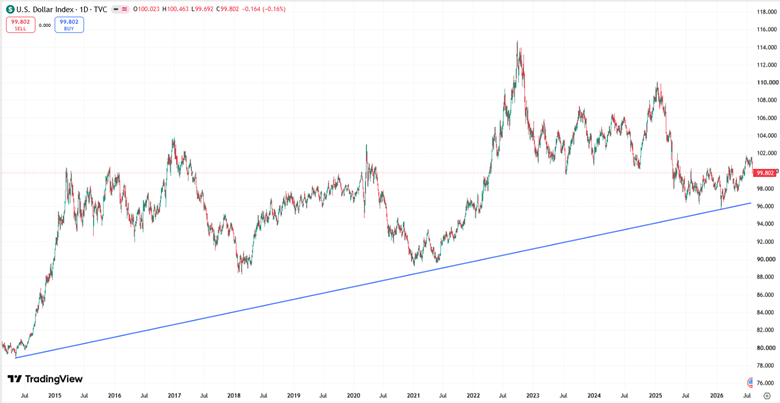
It appears that gold is making a base and should rally higher in the weeks, months and years ahead; however, gold, energy prices, interest rates and currencies are all held hostage to geopolitical developments associated with the reopening of the Strait of Hormuz. The Middle East conflict is critical to a bullish outcome for interest rates, gold, and a Republican victory in November.
Below are four suggestions to aide portfolio repositioning away from the obsolete 60 – 40 stock bond allocation and an overly expensive S&P 500 portfolio toward gold, energy, and emerging markets, which historically do well in an inflationary cycle.
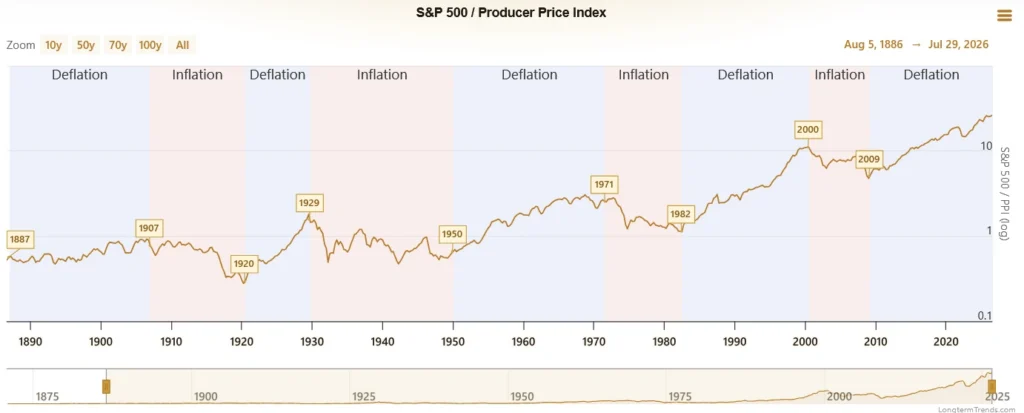
The chart below shows a ratio of the S&P 500 to the PPI has historically correlated with commodity cycles or inflationary cycles which favor emerging markets, foreign stocks, small capitalization stocks, small cap stocks, value stocks, commodities, gold, silver, energy, and a weaker dollar. Rising prices and a declining S&P 500 could easily turn this indicator down and into another pink inflation cycle like the 1970s and the 2000-2009 period.
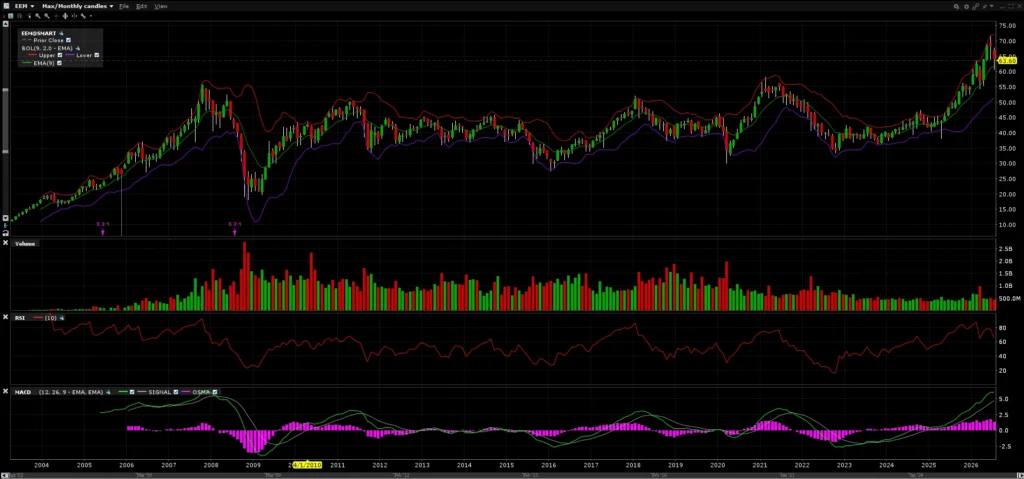
The chart below of the iShares MSCI Emerging Index ETF (EEM)correlates nicely with a period of consolidation during the deflationary phase and now is breaking out of that range and inflation has been above estimates. EEM’s top five holdings are Taiwan Semiconductor Manufacturing Company, Samsung Electronics Co., Ltd., SK Hynix Inc., Tencent Holdings Limited, and Alibaba.
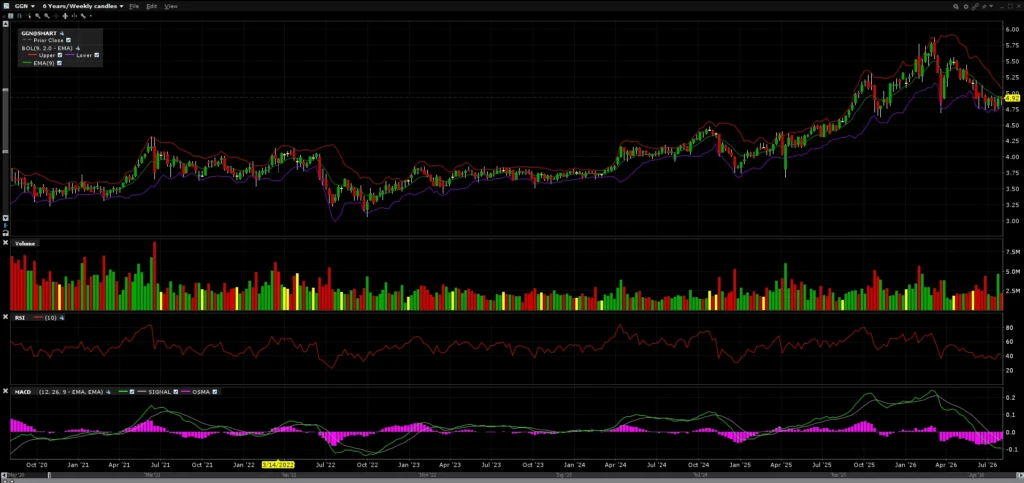
We like the GAMCO Global Gold and Natural Resources & Income Trust (GGN) as an income vehicle because it writes calls against its positions making its 7.35% income generation a function of option time decay. Furthermore, its shares track the price of gold and has a general commodities exposure which is consistent with our inflationary cycle focus.
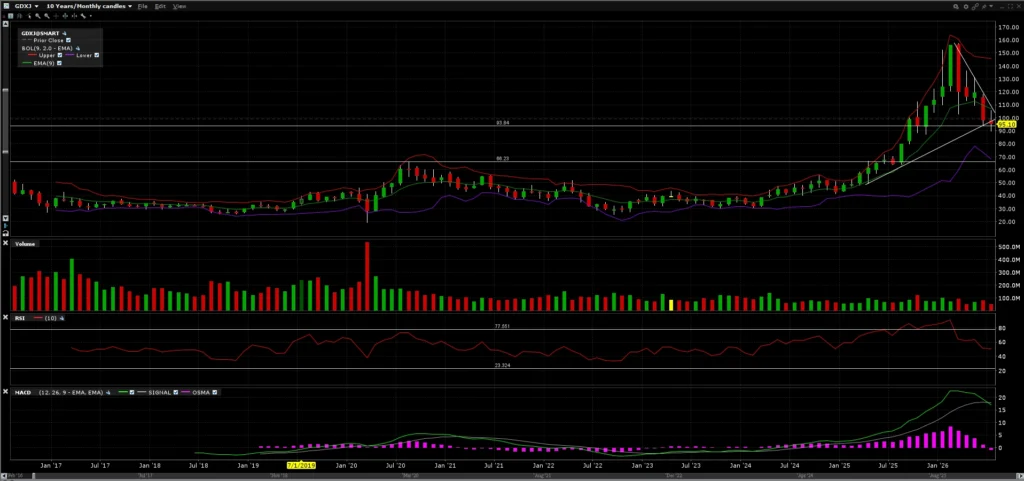
We like the VanEck Junior Gold Miner ETF (GDXJ) as it is a diversified portfolio of gold miners which should provide leveraged returns relative to the price of gold and gold miners are now experiencing a bull market as gold’s elevated price has led to strong profits and revenues in the gold mining sector. If Crescat Capital’s recent research, suggesting a $20,000/ounce per gold future value is correct, GDXJ shares could rise 5x over the next decade.
K92 Mining Inc. (KNTNF) is a 3.4 billion market capitalization gold miner located in Papua New Guinea. It was suggested as an appropriate analogue for what Blue Lagoon Resources, Inc. (BLAGF) could grow into if its drilling program lives up to expectations. Both gold mines benefit from alkaline gold geology resources which generally produce large high grade gold reserves. Shares are trading at 12 times trailing earnings and is still in its growth phase.

Conclusion:
The stock market is overvalued, pressed by rising interest rates and inflation, and is in the midst of several critical trend changes. The war in Ukraine is showing great promise as Ukraine’s domestically developed modern-asymmetric drone-centric defenses are demonstrating real power against Russia’s illegal invasion. The decline in gold appears to be ending and the US dollar appears to be weakening, following a period of strong dollar demand associated with the Iranian conflict. Strength in the emerging markets looks to be benefitting from dollar weakness.
The market is rotating away from large mega cap technology stocks and smaller capitalization companies are demonstrating strength compared to the Magnificent Seven. We believe the post 2000 technology bubble is the proper analogue for todays market and strength in small capitalization stocks, value stocks, commodities, gold, silver and energy should outperform in the years ahead. Diversifying away from a 60% equity 40% bond portfolio should improve portfolio returns, as both stocks and bonds were flat or poor performing allocations in the 1970s and the 2000 to 2009 inflationary cycles which we believe we have entered.
We suggest four investments to help diversify away from the S&P 500, the NASDAQ 100, 60-40 portfolio allocation risk:
- iShares MSCI Emerging Index ETF (EEM) to gain exposure to emerging markets,
- GAMCO Global Gold and Natural Resources & Income Trust (GGN) to generate 7.3% income and increase exposure to gold,
- VanEck Junior Gold Miner ETF (GDXJ) to gain exposure to junior gold miners during the gold bull market, and
- K92 Mining Inc. (KNTNF) to own a high-quality growth gold miner in Papua New Guinea benefitting from its alkaline gold geological resource, low valuation and strong growth prospects.
By adding companies like these, we expect investors will significantly outperform a portfolio that is 60% S&P 500 and 40% 10-year US Treasury Notes over the next decade.