The yield curve or “term structure of interest rates” has changed profoundly since 2019 with the rise in inflation and the federal government’s response to the COVID-19 crisis. The combination of profligate fiscal spending, excessive monetary accommodation, and high fossil fuel prices based on naive “green new deal policies” have created persistently higher inflationary pressures that have fundamentally changed today’s investment environment and will produce new growth markets for the balance of this decade.
Today’s higher for longer interest rate environment will create new investment leadership. Since long term interest rates are no longer abnormally low, housing, real estate, and corporate finance have lost an important financial driver. Higher short term interest rates will create investment competition for all asset classes and make past performance leadership in equities, bonds, and real estate unlikely to repeat itself. One area where past leadership should moderate is long duration — interest rate sensitive — large capitalization growth such as technology stocks. Investment darlings like the FAANG Stocks or the Magnificent Seven helped propel the NASDAQ 100 and the S&P 500 to parabolic peaks. The FAANG stocks: FaceBook (now Meta Platforms, Inc. (META)), Apple Inc. (AAPL), Amazon.com, Inc. (AMZN), Netflix, Inc., and Google (now Alphabet Inc. (GOOG), produced outsized returns that we expect to moderate with higher interest rates. Similarly, the Magnificent Seven which adds Microsoft Corporation (MSFT), Nvidia Corporation (NVDA), and Tesla, Inc. (TSLA) and removes Netflix, Inc. from the FAANGs appear to be the great market leaders of the low interest rate environment and will have to compete for new capital with the new investment leadership in the years ahead. Below is a chart of the FAANG stocks and Magnificent Seven Stocks since May 1, 2012.
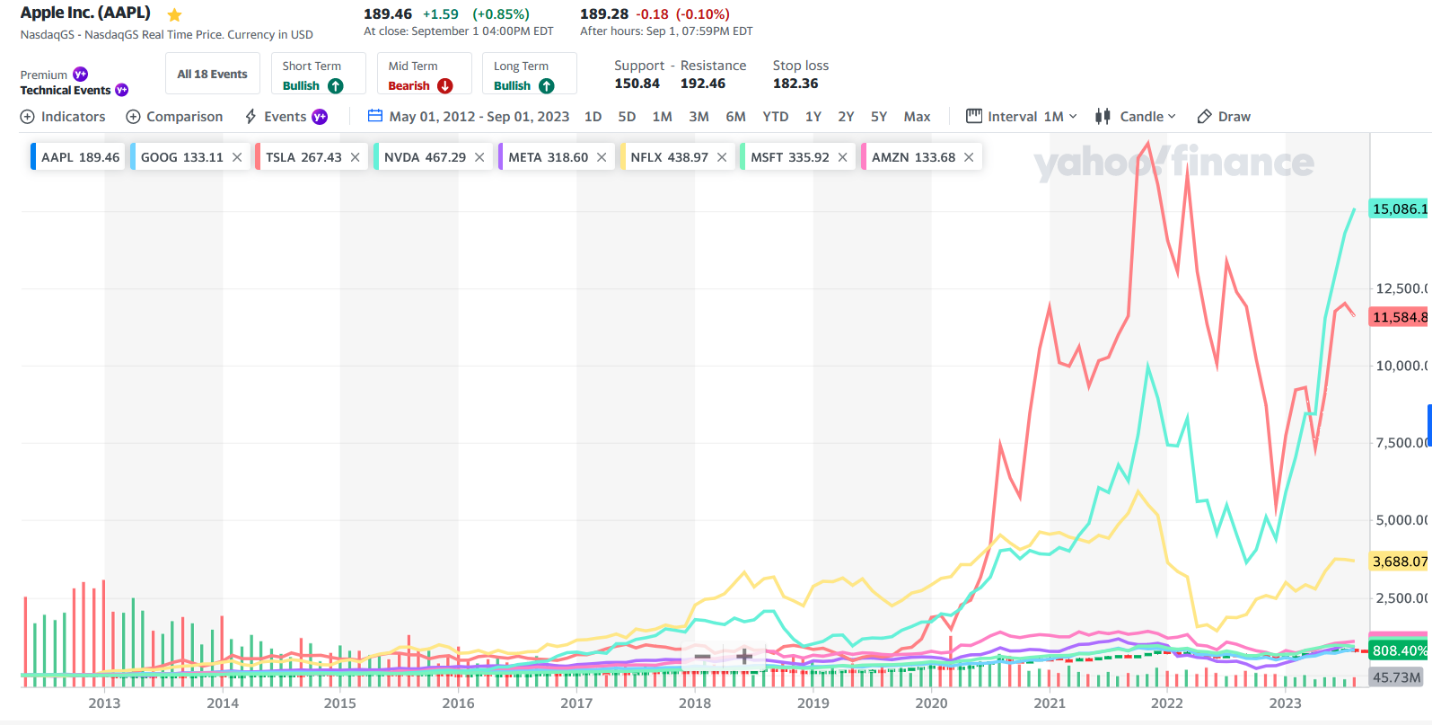
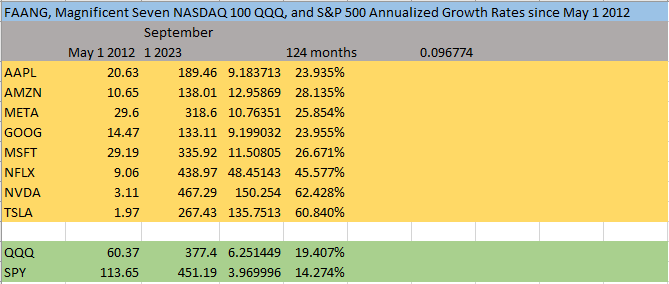
We created a table reflecting the annualized returns of the FAANG stocks, Magnificent Seven stocks, NASDAQ 100 QQQ ETF, and S&P 500 SPY ETF showing their extraordinary appreciation since May 2012. Apple Inc. and Google (now Alphabet Inc.) returned 23% annualized returns for the last 124 months. Tesla, Inc. and NVIDIA Corporation both returned a stunning 60% and 62% annualized returns.
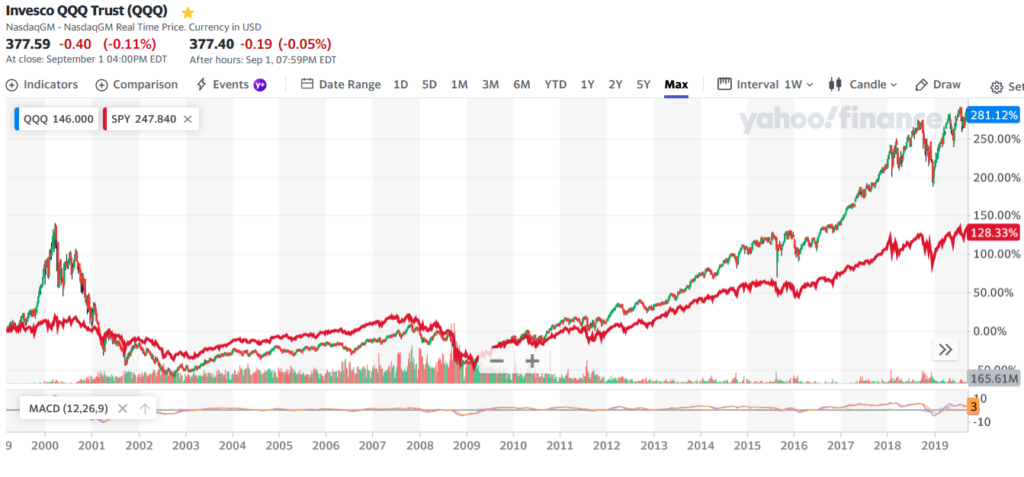
The chart below of the NASDAQ 100 (QQQ) and S&P 500 (SPY) reflect 19% and 14% annualized returns aided by the extraordinary performance of the FAANG and Magnificent Seven stocks. Historically, in less favorable markets, the major indices returned closer to 10% annualized. In the inflationary commodity analogues of the 1970s and 1999 to 2011, S&P 500 returns were close to zero.
US equity markets in the decade of the 2020s should resemble their historic analogues — the 1970s and the 1999-2011 period — when higher interest rates, inflation, and commodity bull markets shaped the investment landscape. Both periods followed equity market bubbles: the Nifty 50 in the early 1970s and the technology bubble in the early 2000s. In both periods, growth, and technology leadership was replaced by energy, commodities, and attractive yield generating investments. Today, equity heavy portfolio allocations like the 60% equity 40% retirement portfolio should be replaced by a 25% cash, 25% commodities, 25% equities, and 25% bond weightings for retirement plans and risk averse retired
investors needing income. Furthermore, the performance of popular indices like the S&P 500 and the NASDAQ 100 will likely pause in a higher interest rate environment like the 1970s. During both the 1970s and the 1999-2011 period, commodities like gold and oil generated significant performance while past equity leadership reverted. We believe the exceptional return performance of the FAANGs and Magnificent Seven stocks will also mean revert.
Based on our post tech bubble investment experience and study of the 1970s, we anticipate new leadership and outperformance in brown and green energy, minerals, mining, precious metals, small and mid-capitalization stocks, emerging, and international markets. Many of these areas offer attractive valuations and could emerge as new investment leadership that replaces the interest rate sensitive large capitalization growth and technology leadership that has dominated investment strategy since the Great Financial Crisis and, more broadly, since 1982 when 10-year US Treasuries yielded 15.2%.
America’s Existential Risk:
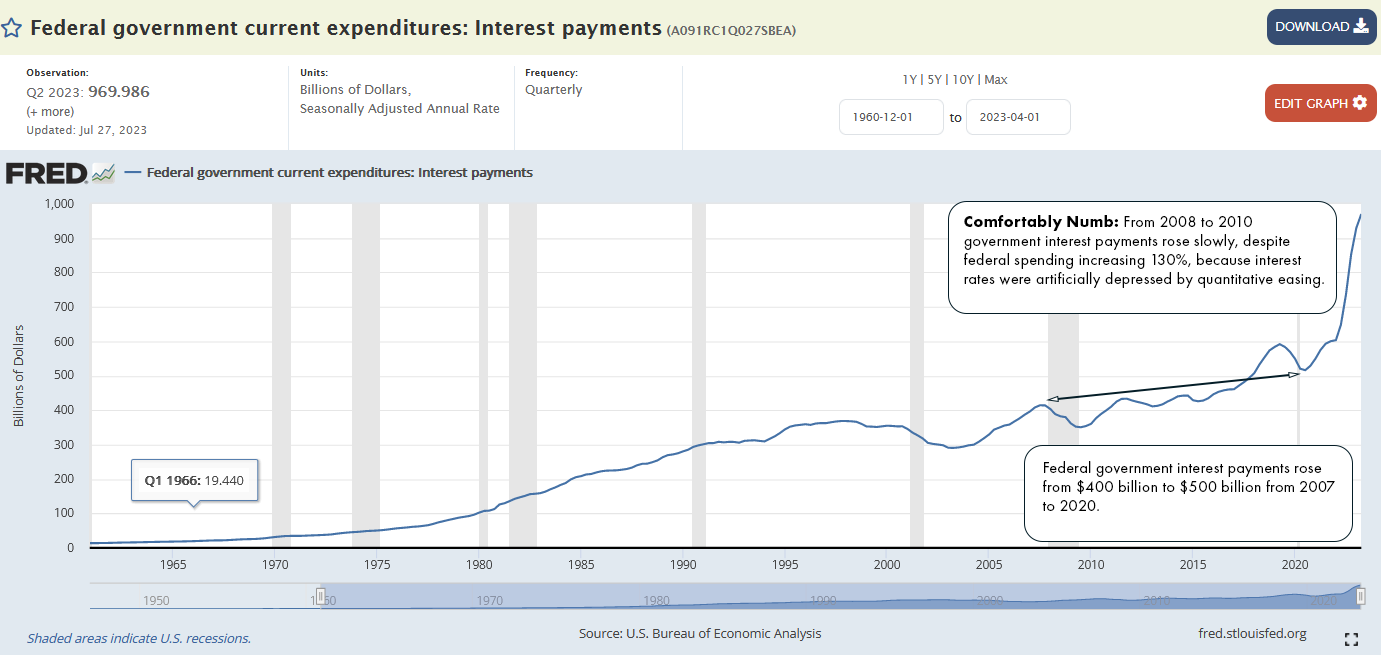
The chart below shows the spiraling rise in annual debt service due on the record $32.8 trillion in Federal debt. Since 2009, the Federal Reserve and US Treasury engineered artificially low interest rates in response to the Great Financial Crisis of 2008-2009 and ensuing global recession. These artificially low rates from 2010 to 2020 allowed for excessive Federal spending and ballooning debt without the normal commensurate rise in the annual debt service which would have occurred in the absence of Federal Reserve and Treasury market actions. With COVID and the rise of inflation beginning in 2020, ballooning federal debt combined with rising interest rates led to a sudden acceleration in annual federal debt expense. The annual Federal interest payments from 2020 of just over $500 billion annually suddenly accelerated to today where it is close to $1 trillion annually — a doubling in less than three years.
Government is incentivized to spend and not manage its expenses because it is easier to win elections promising goods and services rather than cutting expenditures and living within a balanced budget. The 2010 to 2020 periods fiscal and monetary behavior mirrors an irresponsible FOMO consumer with a credit card. That moment of fiscal clarity, when the US population and government forego popular government freebies, usually follows financial crises such as the 1929 stock market crash and Depression and the 1970s inflation spike which resulted in Fed Chair Paul Volker’s legendary Fed tightening which led to 19% Federal Funds rates in 1981. Some believe the 2024 election will be the last bastion for fiscal conservatism to reverse the profligate policies which have created today’s inflation. Recent history suggests that this prelude to the Presidential election of 2024 will be rife with partisan politics. A politically divided country will detract from market stability.
Modern Monetary Theory is a Fraud:
During the late twenty-teens, a theory of unconstrained Federal spending without consequence was popularized in Modern Monetary Theory (MMT). “According to MMT, governments do not need to worry about accumulating debt since they can create new money by using fiscal policy in order to pay interest.” According to Bloomberg, Modern Monetary Theory is a concept Warren Buffet hates but Alexandria Ocasio-Cortez supports. Furthermore, it appears to be the economic rationale for the Green New Deal. Income Growth Advisors, LLC has cautioned that the idea of the Federal Reserve buying massive quantities of Treasury securities (aka Quantitative Easing “QE”) was a recipe for disaster akin to “borrowing from Peter to pay Paul.” The naïve popular belief in MMT has now resulted in massive Federal debt that has combined with rising interest rates and created an unsustainable debt spiral and accelerating Federal debt service.
Comfortably Numb:
From 2008 to 2020, the quantity of Treasuries owned by the Federal Reserve quadrupled from $1 trillion to over $4 trillion, as shown in the chart below.
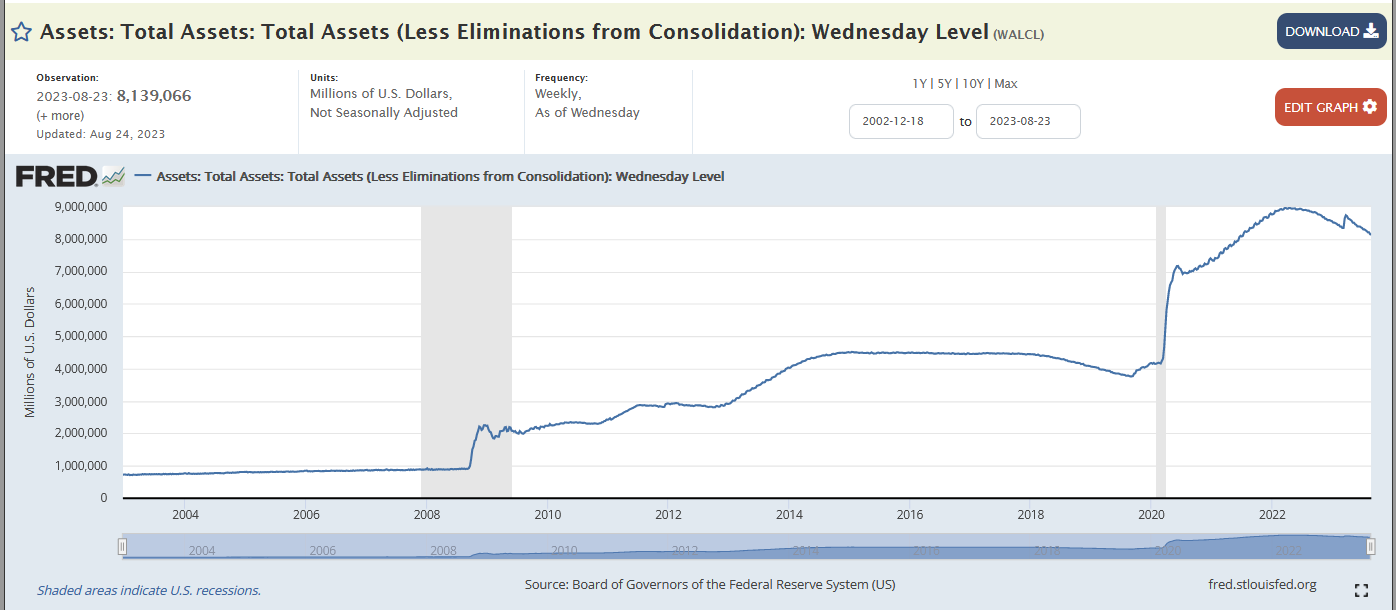
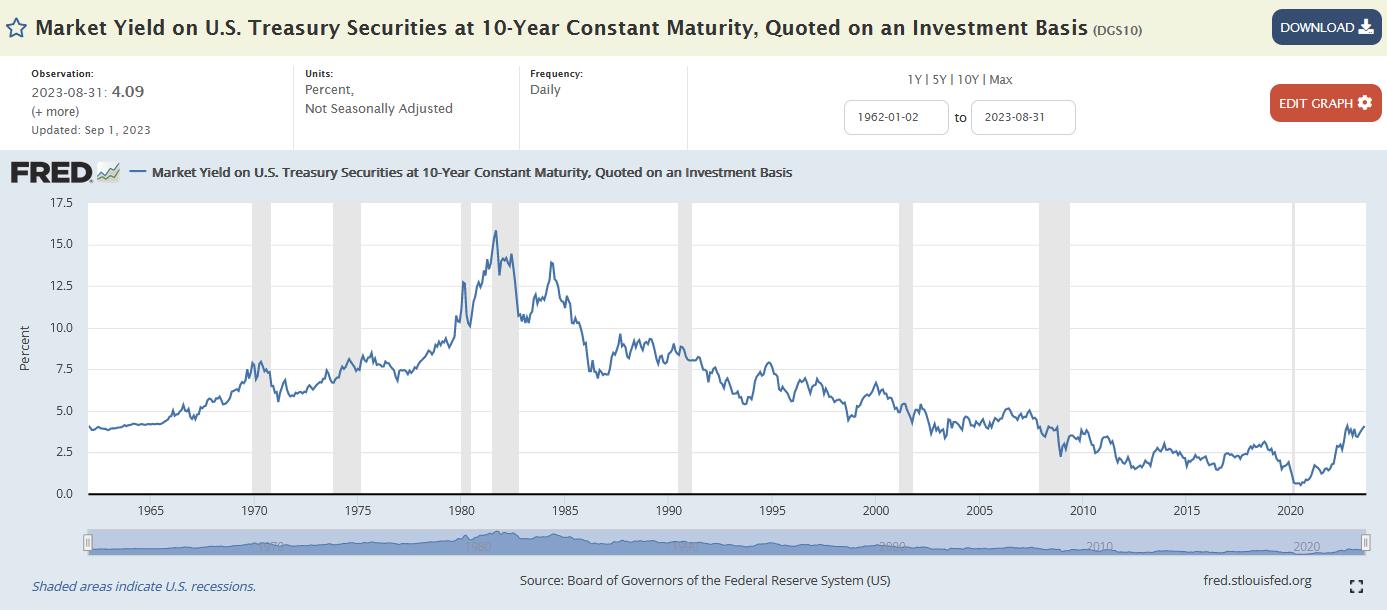
In 2008, the Federal Reserve embarked on a new financial accommodation called Quantitative Easing. Quantitative easing is when the Federal Reserve buys US Treasury Securities such as the 10-year Treasury Note to provide economic stimulus. From 2008 to 2020, 10-year US Treasury yields declined from nearly 4% to 0.5%. This dramatic decline in the yield of the 10-year US Treasury note helped to mask the financial consequence of the growing US debt, because our Federal Debt grew from $10 trillion in 2008 to $23 trillion in 2020, the debt service remained relatively flat.
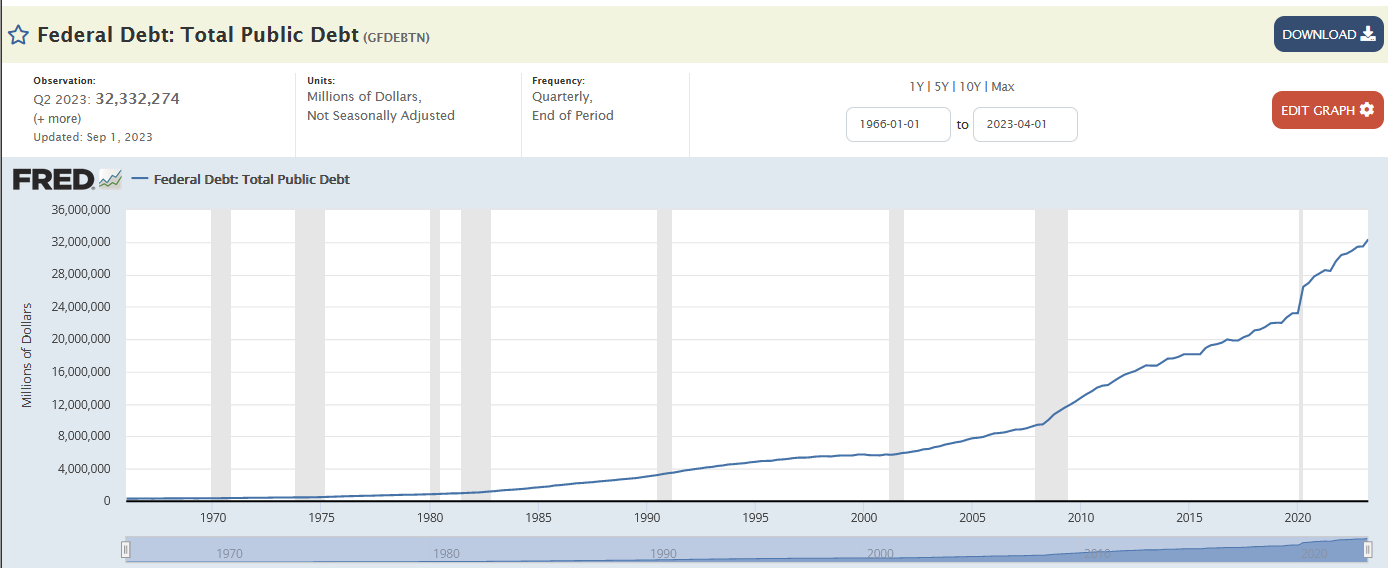
Below is a chart of the US Federal Debt. Today it is $32.8 trillion. In 2008 it was $10 Trillion.
The Era of Free Money is Over:
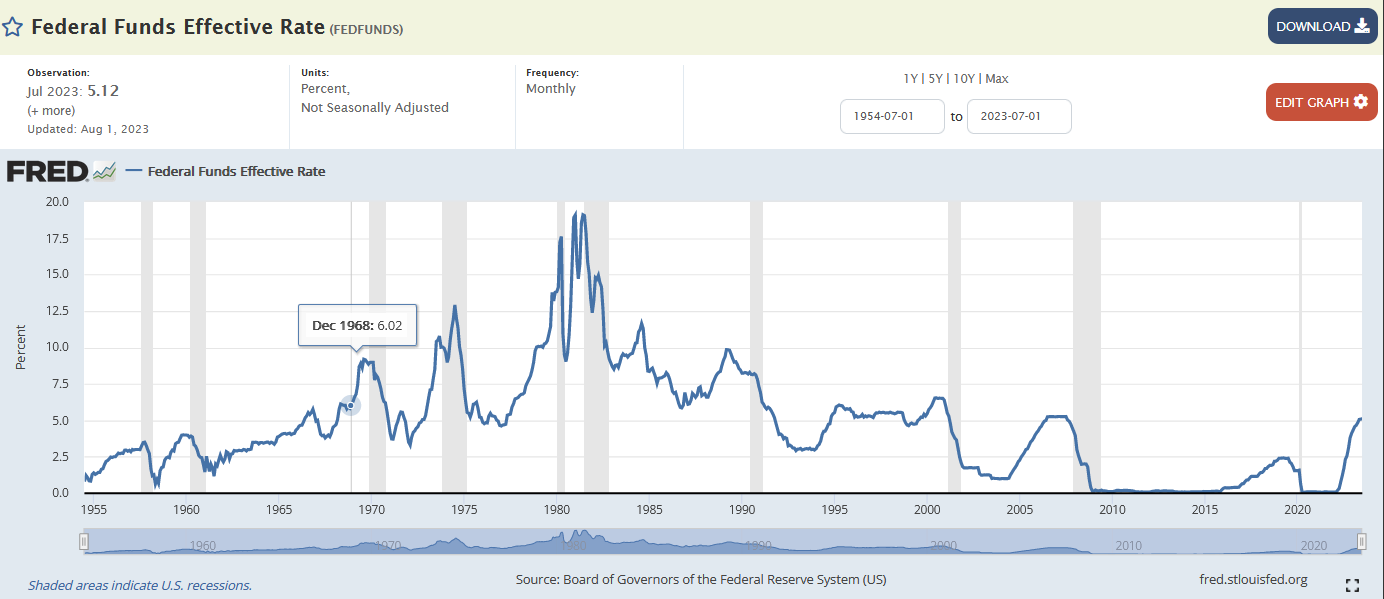
The Federal Funds rate is the primary instrument of the Federal Reserve. The chart below shows that the Federal Reserve lowered the Fed Funds rate to near zero since 2010, effectively allowing banks to borrow money for free and invest the balance for a simple operating profit. This was helpful to bank profits and stimulative to the economy; however, near zero interest rates force traditional savers to allocate capital in other assets to attain an income that was critically important to retirement aged investors. Higher short term rates means that investors now have a low risk investment option which had not been available to them in recent years. Higher short-term interest rates means that less money will go into stocks, bonds, and real estate, and this will hurt their longer term return prospects and investment appeal.
10-Year US Treasury Rates are Competition:
From 2010 until 2022, the Federal Reserve engaged in Quantitative easing which was when the Federal Reserve engaged in buying programs of US Treasury securities like 10-year US Treasuries. This policy allowed the Federal Reserve to create artificially low interest rates which was conducive to economic activity such as real estate investment. By lowering interest rates, valuations of stocks, bonds, and real estate rose. With the 10-year US Treasury now yielding 4.17%, an argument can now be made for owning 10-year US Treasuries due to their yield improvement over the period following the Great Financial Crisis. We don’t believe 10-year US Treasuries are particularly attractive investments because there is a chance that inflation could re-accelerate and the yield on 10-year US Treasuries could rise to 5% or 6% if the global economy skirts a recession and commodity prices rebound.
Equity Valuations and The Fed Model:
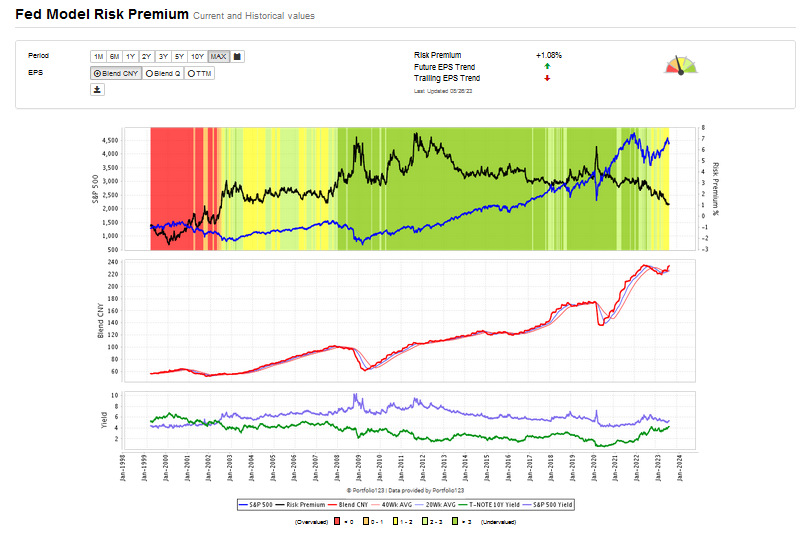
Valuations are not absolute. A fair value for the S&P 500 is not simply based upon the index’s own metrics like cash flow and book value per share. A fair market value of the S&P 500 should account for alternative asset prices. Since the S&P 500 and the 10-year US Treasury are the most widely used benchmarks for stocks and bonds, the Federal Reserve Model or the Risk Premium model provide a convenient comparison between the earnings yield of the S&P 500 and the 10-year US Treasury yield.
The chart below shows that the Risk Premium is 1.08%, the lowest level since 2002 during the post tech bubble decline. While the economy has stabilized and recession risks are declining, neither continued lower inflation, lower interest rates, nor the avoidance of a recession is assured.
Equity Valuations are Not Attractive:
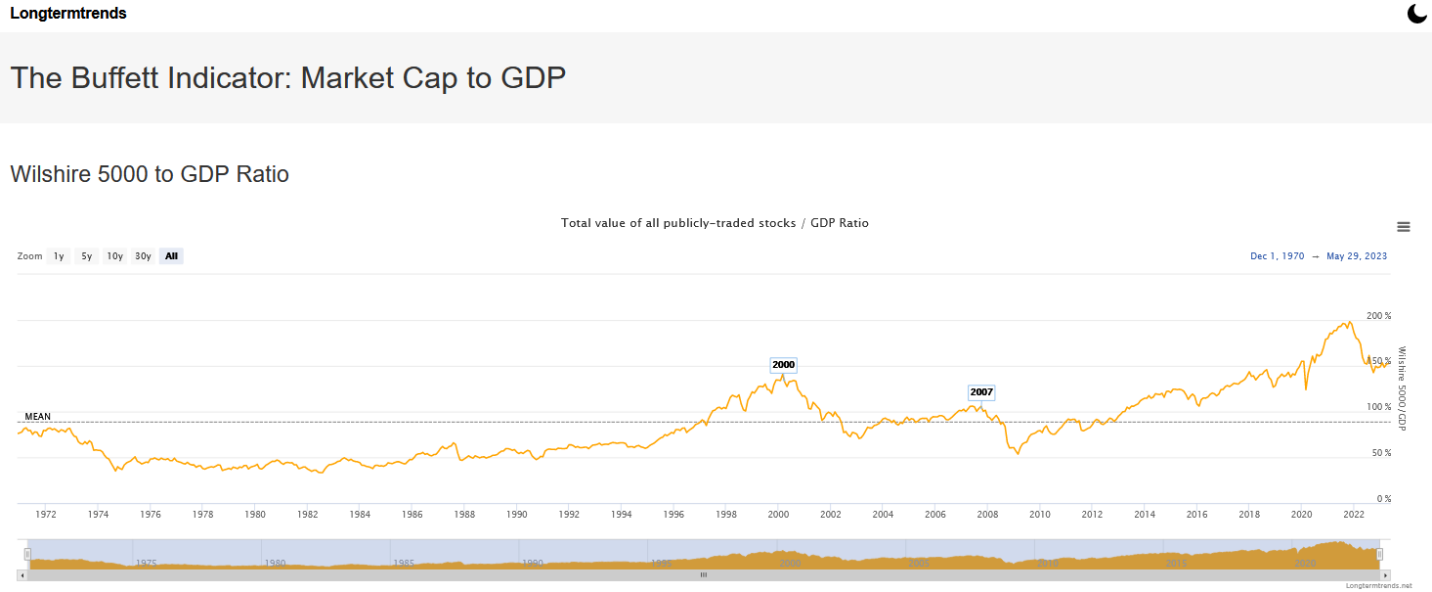
The Buffett indicator, which compares the Wilshire 5000 market capitalization to the US GDP, provides a handy valuation perspective by comparing the tangible GDP revenue number with the market’s psychological state as reflected in the market capitalization of the Wilshire 5000. Our concern is that equity market downside risk today suffers from recency bias. That is since the Great Financial Crisis, artificially low interest rates and profligate government spending created booming equity conditions that no longer are present. The Buffett Indicator Chart below shows this ratio is 1.66 versus a mean of 0.89, and implies a 86.5% stock market premium to its historic mean level. We don’t see this Buffett indicator as a market timing instrument, we see a protracted moderation in this multiple over the next decade or move comparable to the 1970s and the post-2000 technology bubble equity market.
Commodities: A Risk and an Opportunity:
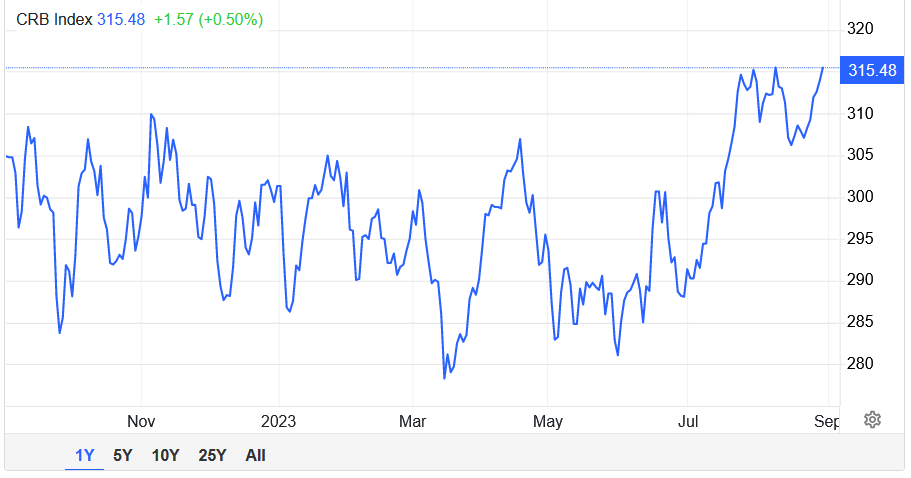
We believe we are in a commodity super cycle and commodities should continue to generate attractive performance since commodities had bottomed in 2020. The CRB Index has a 39% weighting in energy. Due to underinvestment in both brown and green energy over the last decade, we expect the CRB will continue to rise in the years ahead. The chart below of the CRB Index shows it is poised to break above last year’s price range. Rising commodity prices are an opportunity for investors, but a problem for financial markets hoping for the Federal Reserve’s stated 2% inflation target.
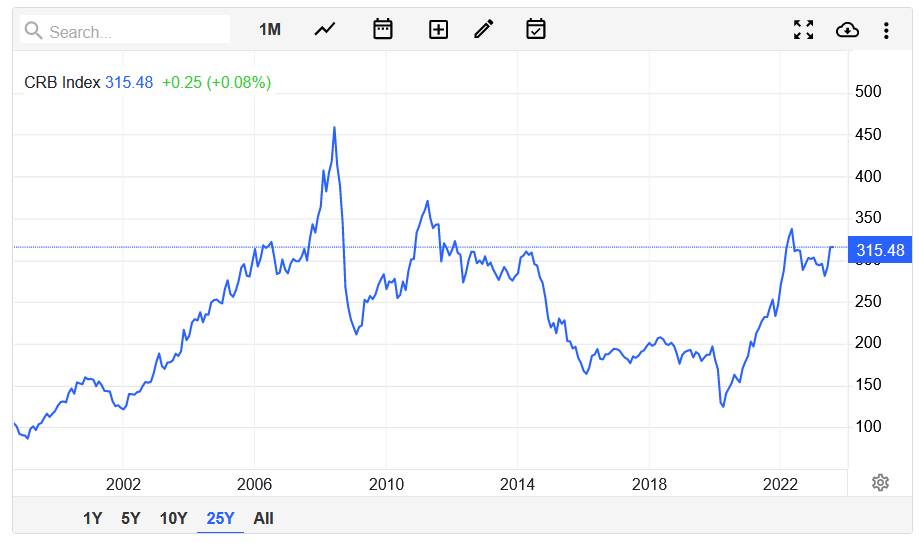
The 25 year chart below of the CRB Index shows that Commodities rallied from 1999 to 2008 a nine year advance. For commodity prices to moderate we would need to see new production in green and brown energy as well are in metals and minerals and those capital cycles will need at least another five years to produce surplus capacity to meaningfully reduce price pressures in commodities. Five years of higher commodity prices could be problematic for stock and bond performance.
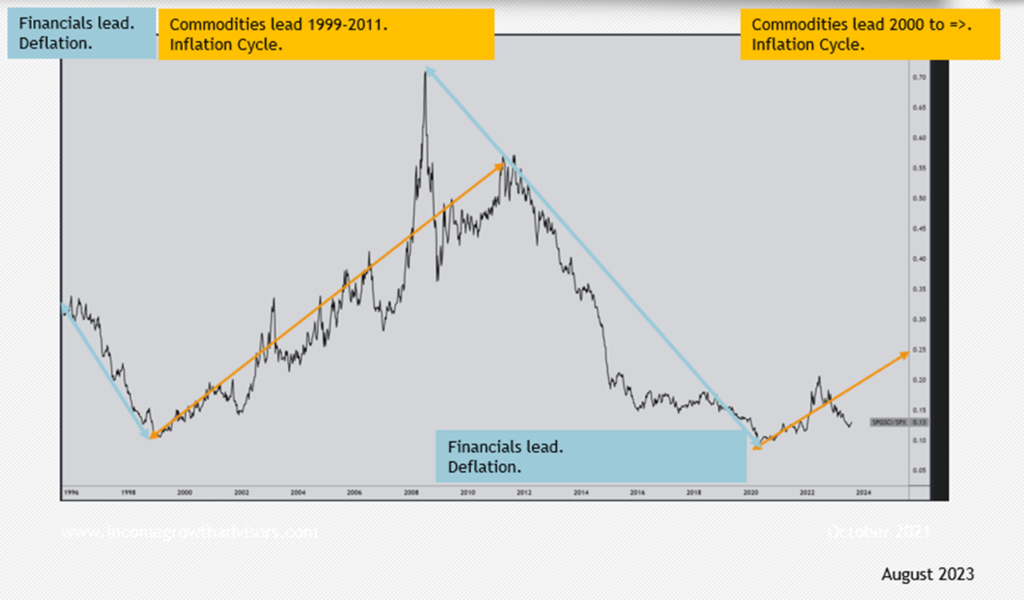
The Great Rotation:
We have entered an inflationary commodity cycle where equities experience an investment rotation from growth to value and changing investment leadership driven by higher interest rates and rising commodities. The chart below of the ratio of the CRB Index divided by the S&P 500 index and a rising trend reflects and inflationary commodity cycle. Furthermore, when the ratio line is declining, it reflects an environment where equities outpreform and commodities underperform.
Conclusion:
The prescription for successful investment strategy for the remainder of the decade of the 2020s, will be decidedly different than the historic precedent reflected in the past performance of major indices and asset classes.
The primary difference between the post Great Financial Crisis and the forty year period of declining interest rates is that the term structure of interest rates will not provide low or declining rates which unequivocally lifted the returns of stocks, bonds, and real estate. Due to higher inflation, both short-term and long-term interest rates will be higher and stocks, bonds, and real estate will endure performance head winds where in the past these asset classes enjoyed a persistent tailwind.
Modern Monetary Theory and Quantitative Easing created an irresponsible confluence of easy money that drove excessive government spending and a $32.8 trillion debt and spiking nearly $1 trillion annual Federal debt service obligation that could lead to an existential financial and economic crisis. Investing in green and brown energy, minerals, mining, fixed income and money market funds will help to mitigate portfolio risks baked into the 60% stock 40% bond asset allocation popularized since 1982 when 10-year US Treasuries yielded 15.2%.
We believe that we are now in an inflationary commodity cycle where investing in commodity correlated assets represent one broad area where investments can be made at an attractive valuation level and meaningful growth potential exists. Green and brown energy, green metals are markets where new production will be essential to grow the global economy. Precious metals also offer low valuations in a world where monetary instability is growing.
As human beings, we are drawn toward recency bias where we tend to extrapolate recent trends rather than take a longer term view of investment and markets. Philosopher George Santayana famously warned “Those who do not learn history are doomed to repeat it.” Recency bias makes investors, the government, and the public disinterested in historic periods of financial consequence like the 1929 stock market crash and ensuing Great Depression, or hyperinflation of the Weimar Republic, or the Volker era of 19% Federal Funds rates following the late 1970s when inflation spiraled uncontrollably.
While none of these history periods of economic misery are an immediate risk, how, in the months and years ahead, the government and voting public confront the accelerating rise in Federal Debt service will have meaningful import to the investment environment. Those not thinking about historic valuation, growth, and risk management could be sorely disappointed if they stick with a 60% equity 40% asset mix and cling to popular capitalization weighted indices like the S&P 500 and the NASDAQ 100.
Most obvious to our thinking is that a 25% cash, 25% commodities, 25% stock, and 25% bond asset allocation will produce attractive income, inflation protection and reduce duration and equity risk without sacrificing potential growth. The domestic political scene is unpredictable and highly partisan. The international political environment is fraught with conflict potentially with nuclear armed Russia and China. Consequently, dialing back risk in investment strategy by investing in value and yield make good sense for at least the next two years and possibly remainder of the decade.