Geopolitical conflicts, inflation, and higher interest rates are adding uncertainty to the popular soft landing scenario as we enter into 2024. Conversely, death and taxes are certain, so this letter will review some tax bounce opportunities that only occur this time of year.
From a historical perspective, assets like stocks, bonds, and real estate have enjoyed both artificially low interest rates, since 2008, and a four decade cycle of declining interest rates. This has created overvaluations in interest rate sensitive assets, especially equities, bonds, and real estate. Furthermore, recency bias will give investors unrealistic optimism regarding stocks, bonds, and real estate investment prospects. Consequently, after nearly forty years of declining rates and with the last 15 years of artificially low rates, investors are biased to believe that stocks, bonds, and real estate will provide the best investment returns based on their track record and favorable recent histories. However, the drivers of those returns — declining interest rates and low inflation, and Federal Reserve policies that created artificially low rates — have ended.
To forecast market performance, we have studied the 1970s and the 1999-2011 periods as recent analogues to today’s environment. In both periods, stocks declined or consolidated, but commodities rallied. In both periods, wars, rising inflation, and rising interest rates played prominent roles. Both inflationary periods followed stock market bubbles. Consequently, we are rotating from bubble investments, like the “Magnificent 7” stocks – Apple Inc. (AAPL), Microsoft Corporation (MSFT), Alphabet Inc. (GOOGL), Amazon.com, Inc. AMZN, Nvidia Corporation (NVDA), Meta Platforms, Inc. (META) and Tesla, Inc. (TSLA) — and into international and emerging market stocks, value, and commodity investments. Most importantly, we are reducing the duration of our investment portfolios. If our forecast proves accurate, commodities like gold and energy should massively outperform, while equities consolidate as their earnings multiples mean revert over the next decade. We believe the 60% equity and 40% bond allocation model is flawed and retired individuals should embrace a 25% cash, 25% commodity, 25% stock, and 25% fixed income strategy. This 25/25/25/25 asset allocation strategy should provide lower portfolio risk, better income, and better performance than the popular 60/40 strategy over the next decade.
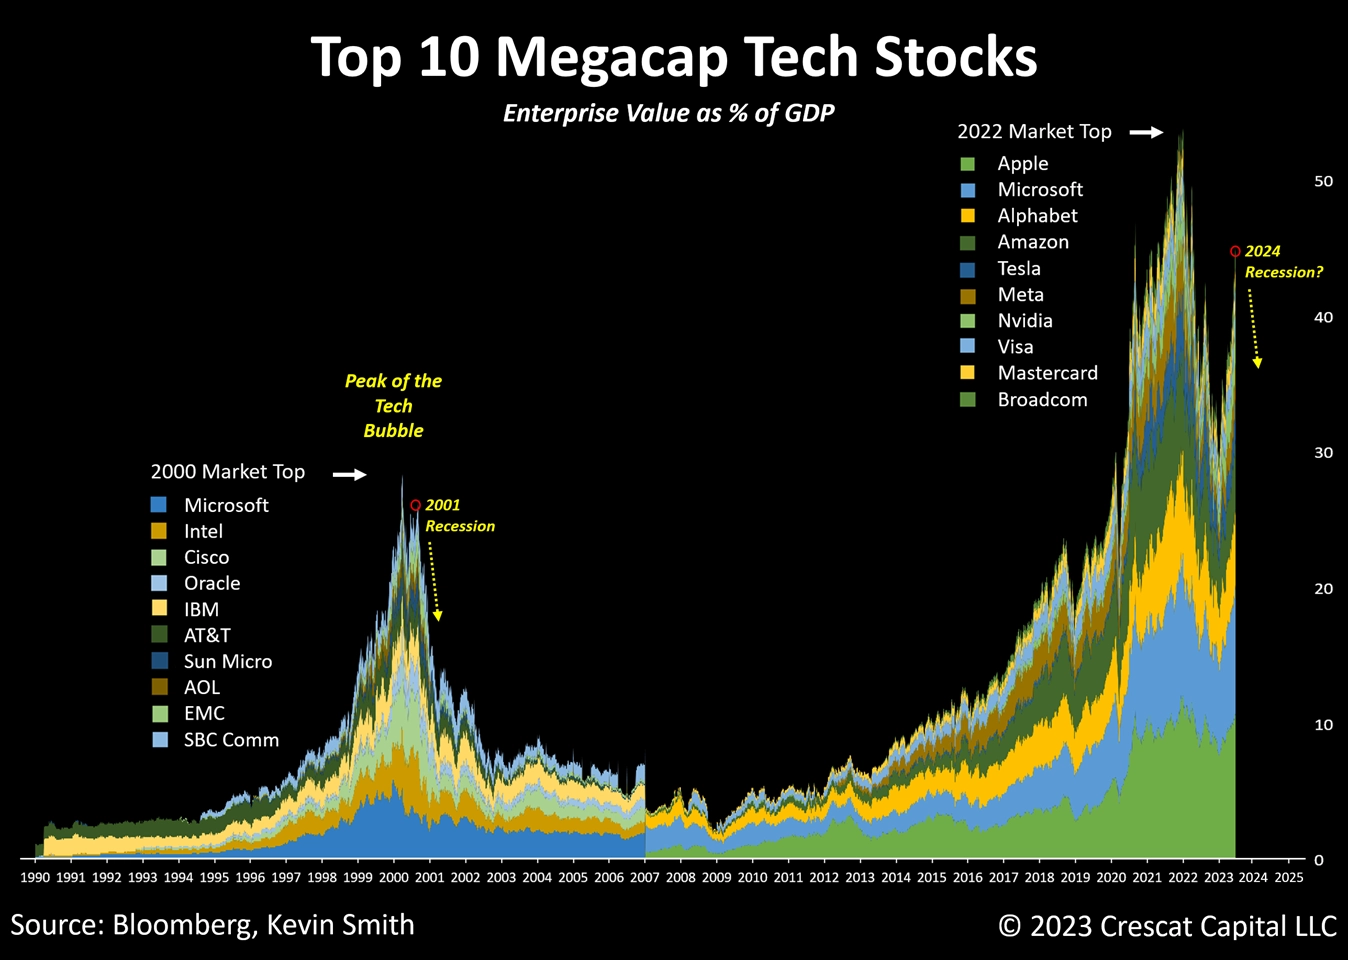
Below is a chart of the top ten Megacap Technology companies in 2022 compared to the top ten megacap tech stocks around the 2000 bubble. We believe this current bubble resembles the 2000 tech bubble in many ways. Today’s Megacap bubble also bears similarities with the Nifty Fifty in the early 1970s and the 1929 market peak. Philosopher George Santayana famously said, “Those who do not study history are doomed to repeat it.” The idea for historical analogues came from Robert Levin who worked as a market strategist for both Louis Moore Bacon and Paul Tudor Jones.
Market Cycle Perspective:
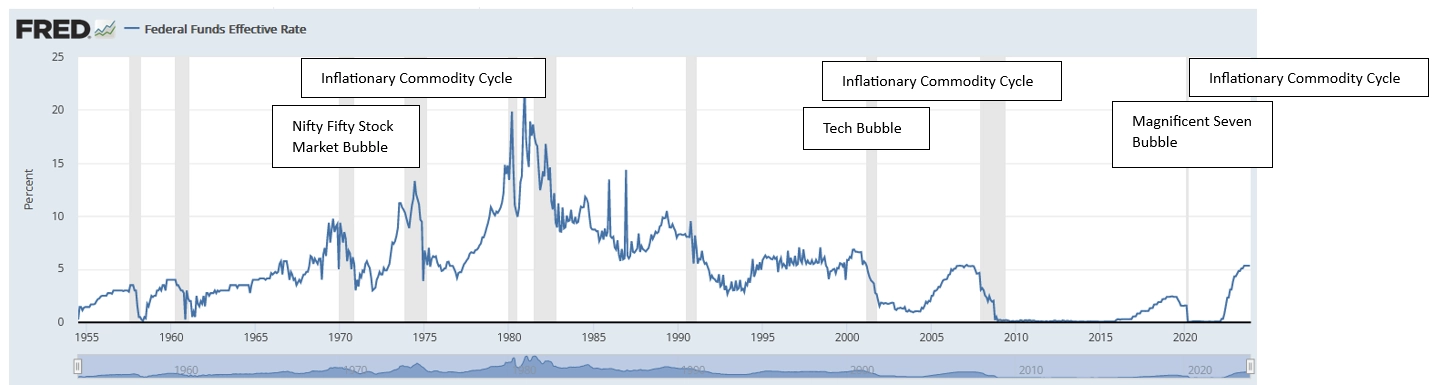
The Federal Funds Rate chart below shows that the last three generational bubbles preceded inflationary commodity cycles in the 1970s, 1999 to 2011, and the current cycle which commenced in 2020. In addition, the chart shows the near zero Fed Fund rates that helped to propel exceptional returns in stocks, bonds, and real estate for the last 15 years.
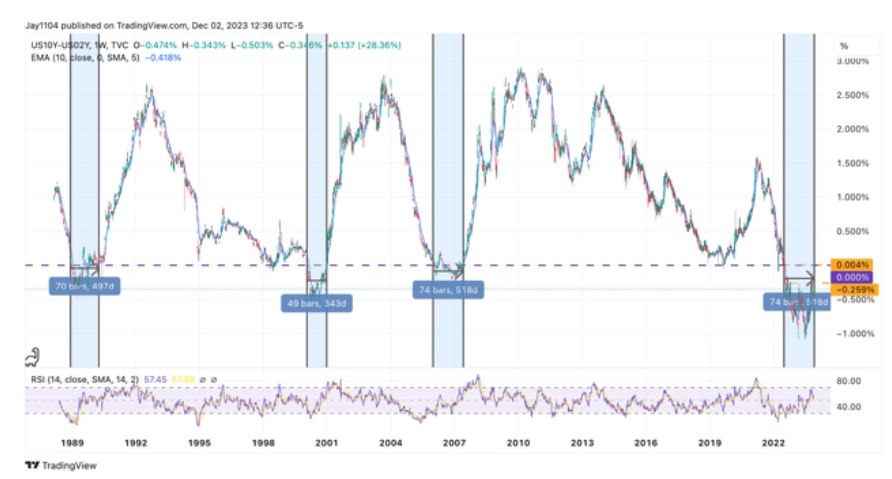
The inverted yield curve historically forecasts economic recessions, consequently many strategists forecast and economic slow down in 2023, including ourselves, that never materialized. Historically, when the yield curve normalizes, and the spread between 10 year Treasury and two year Treasury yields turns positive the stock market declines as it did in 1990, 2000, 2008, and 2020. The chart below shows this risk graphically.
Potential Market Risks:
On October 7th, 2023, Hamas terrorists attacked Israel and this unprovoked attack could expand into a larger regional conflict. Additionally, the Russian invasion of Ukraine, has created geopolitical uncertainty, inflation, and recessionary risks for the foreseeable future. Add in North Korea and a provocative China to this global landscape, the world order is under pressure and may remain problematic for years.
The US political environment has grown intensely partisan. The 2024 presidential campaign features a likely rematch of the contentious 2020 campaign with both Biden and Trump sporting high disapproval ratings. We believe the partisan domestic political environment in 2024 will make markets even more fraught.
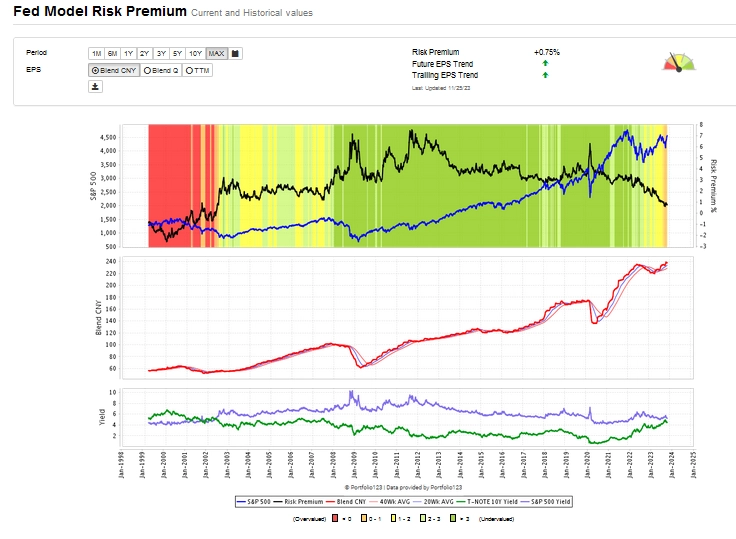
The Risk Premium Model chart below shows that both the S&P 500 Index and earnings have done well in 2023, despite the sharp rise in the Fed Fund rate and 10-year US Treasury yield. However, the chart also shows that stock prices relative to bonds are no longer a bargain. The last time the S&P 500 was this expensive, relative to bonds, was in 2002 amid the post-Tech Bubble bear market.
The economy is finally slowing with higher short and longer term interest rates following the substantial tightening by the Federal Reserve and reversal of its quantitative easing programs. US consumer credit card debt has now exceeded $1 trillion, the employment picture is cooling, and home and automotive affordability have dropped to historic lows which suggests that consumer spending will slow. These factors have led to a sharp decline in 10 – year US Treasury yields from 5.02% to 4.23% since October 23rd. The danger is that all recessions are preceded by a slowdown. If a recession occurs, unemployment could rise, and earnings could turn down and lead to a bear market in US equities.
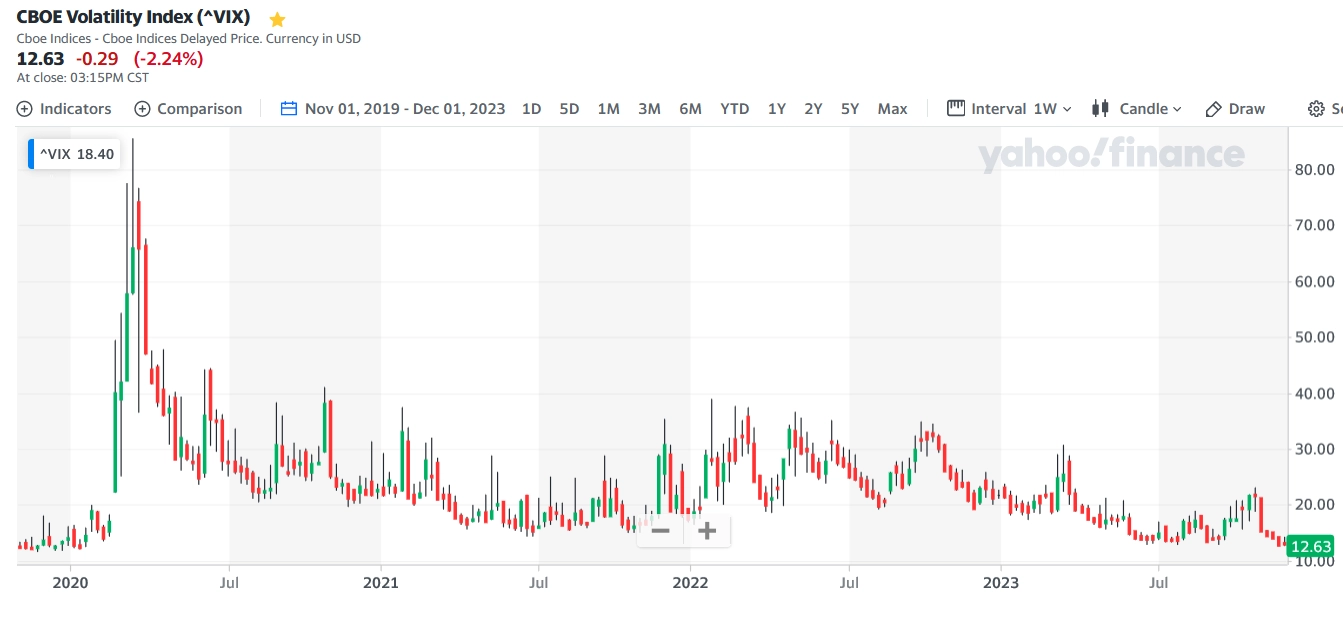
With high valuations, a potential consumer slowdown, and high levels of risk, investment caution is warranted. This market risk is objectively captured by the CBOE Volatility Index and is trading near five year lows. Market declines frequently are telegraphed when investor concern is low, and today’s VIX is close to levels reached in late 2019, before the COVID-19 market crash. Caution is warranted today, and a conservative asset allocation strategy is a logical approach. The chart below of the CBOE VIX gives a quantitative measure of market risk. Markets should be bought when the VIX spikes and or is over 30. Historically, when the VIX is below 15, market declines often follow.
Commodities:
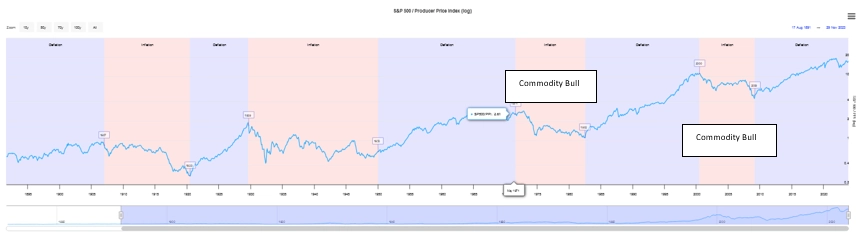
Over the last 140 years, equity markets and commodity markets have swapped leadership roles largely based on inflation. The chart below shows those inflationary and deflationary periods with the last two inflationary periods being the 1970s and the 1999 to 2009 period. The chart below shows the S&P 500 index divided by the producer price index (log scale). Periods tend to be 10-20 years in length. Periods of low or declining interest rates normally exhibit strong S&P 500 performance. Conversely, inflationary periods have exceptional commodity performance and muted equity performance. This leads to the great rotation we see unfolding, where equities will underperform and commodities outperform.
During both inflationary cycles, substantial gains were made in the price of oil and the price of gold. We believe that gold looks especially promising today now that the Federal Reserve’s tightening cycle appears to be ending.
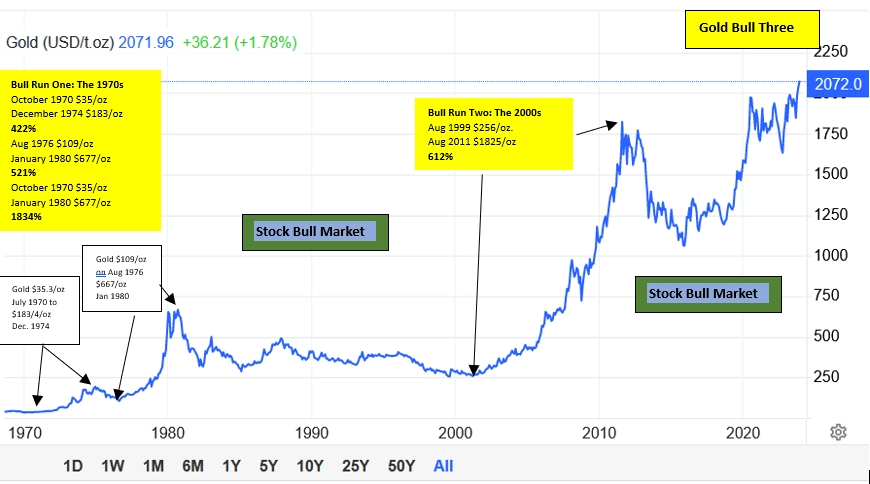
Below is a 50 year chart of gold. In the 1970s, gold enjoyed an 1834% move which was significantly enhanced by the fact that gold came off the gold standard and was initially fixed at $35 per ounce. Gold peaked at $677/oz. in January 1980. Gold had another major run from $256/oz. on August 1999 and rallied to $825/oz. in August 2011. That bull move was 612%. We believe a new bull market in gold has commenced now that the Federal Reserve and ECB appear to be ending their tightening cycles. We believe that a major move in gold is likely, while the S&P 500 consolidates over the next decade.
The January Effect:
Every year, investors sell securities to realize tax losses and reduce their tax liabilities. This “tax loss harvesting” leads poorly performing stocks to endure tax loss selling regardless of the fundamental case for that particular security. This tax selling creates investment opportunities for stocks strictly for tax purposes. The January effect creates oversold and artificially depressed prices and, frequently, rewarding investment opportunities.
Typically, tax loss selling begins in early November and ends around December 15th. The idea is to scoop up these bargains and hold them until mid-January or February, when investors return to repurchase those stocks after 31 days have elapsed.
Below are four stocks that we believe are not only compelling tax bounce candidates but could enjoy positive news in the coming months or are in sectors which should outperform longer term.
GoldMining Inc. (GLDG) is a $167 million market capitalization international gold mining company. The chart below shows the shares were priced at $3 in 2021 and now are $0.93/share.
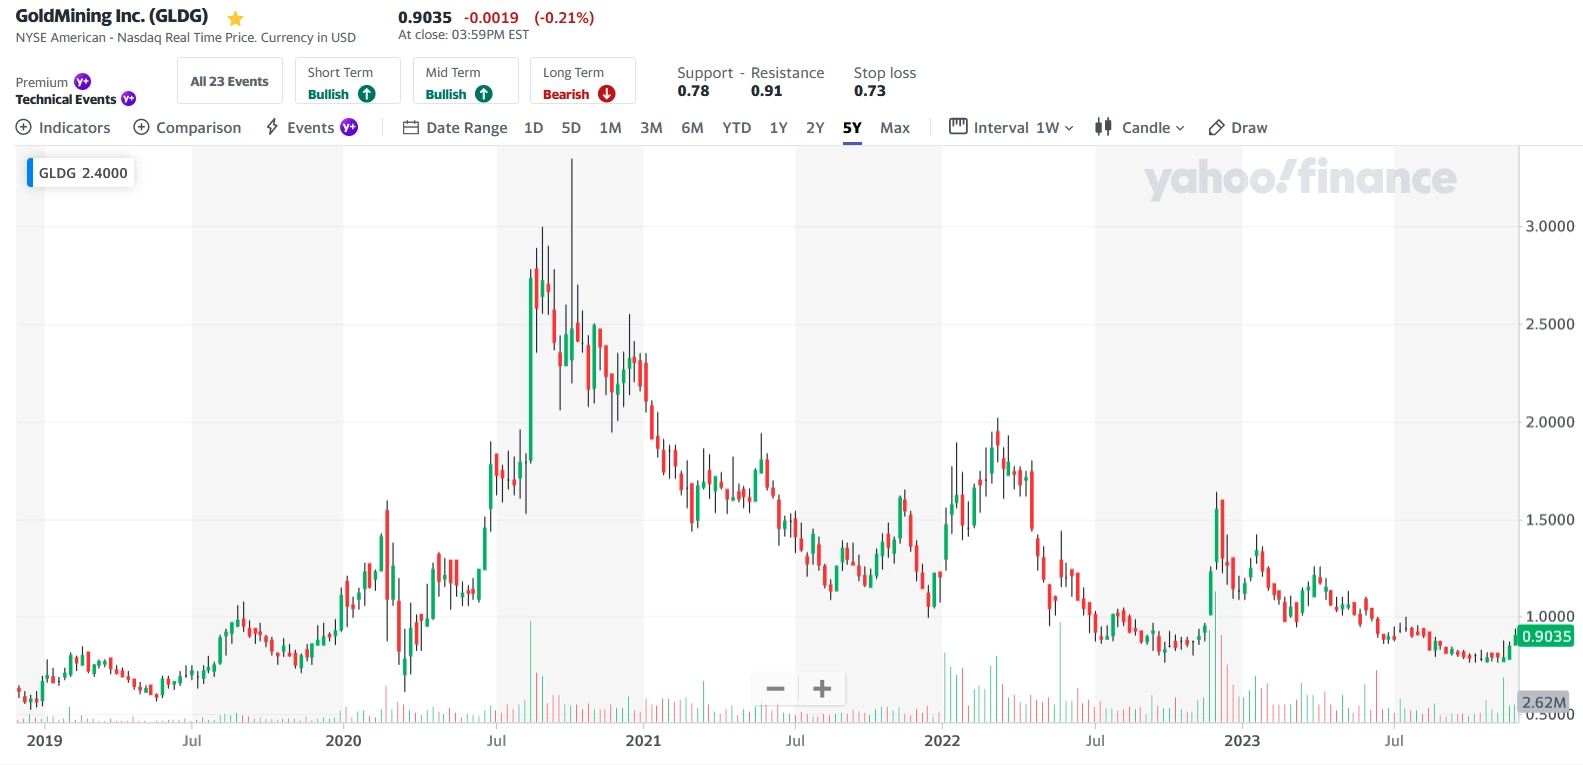
GLDG shares have an attractive 0.72/share book value and a current ratio of 17. Van Eck owns almost 10% of the shares either directly or through its Junior Gold ETF. The shares should enjoy a year-end tax bounce and could perform well for years if gold prices continue to rise.
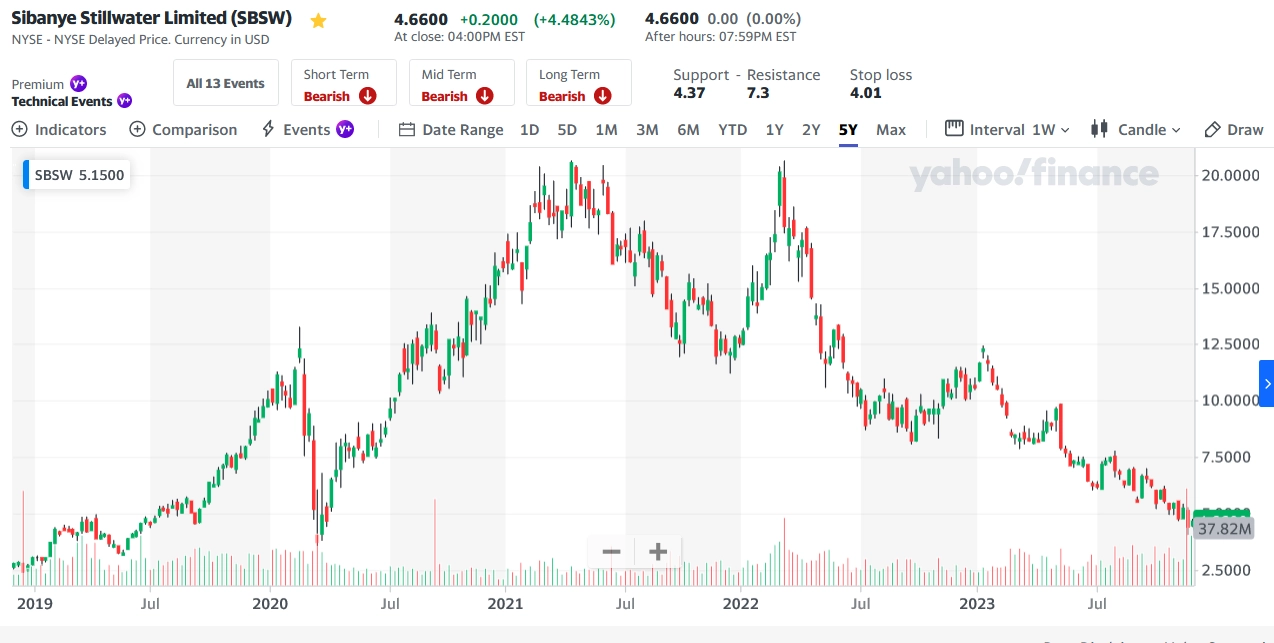
Sebanye Stillwater Limited (SBSW) is a $3.18 billion market capitalization global precious metals mining company in South Africa, the United States, Europe, and Australia. The company produces gold; platinum group metals (PGMs), and minerals important to the energy transition including palladium, platinum, rhodium, iridium, and ruthenium; lithium; chrome; nickel; and silver, cobalt, and copper.
We believe the company should be a broad beneficiary of rising metals and mineral prices after broad weakness in the mineral sector in the last two years. The company completed a convertible offering providing liquidity for operations and an attractive entry point.
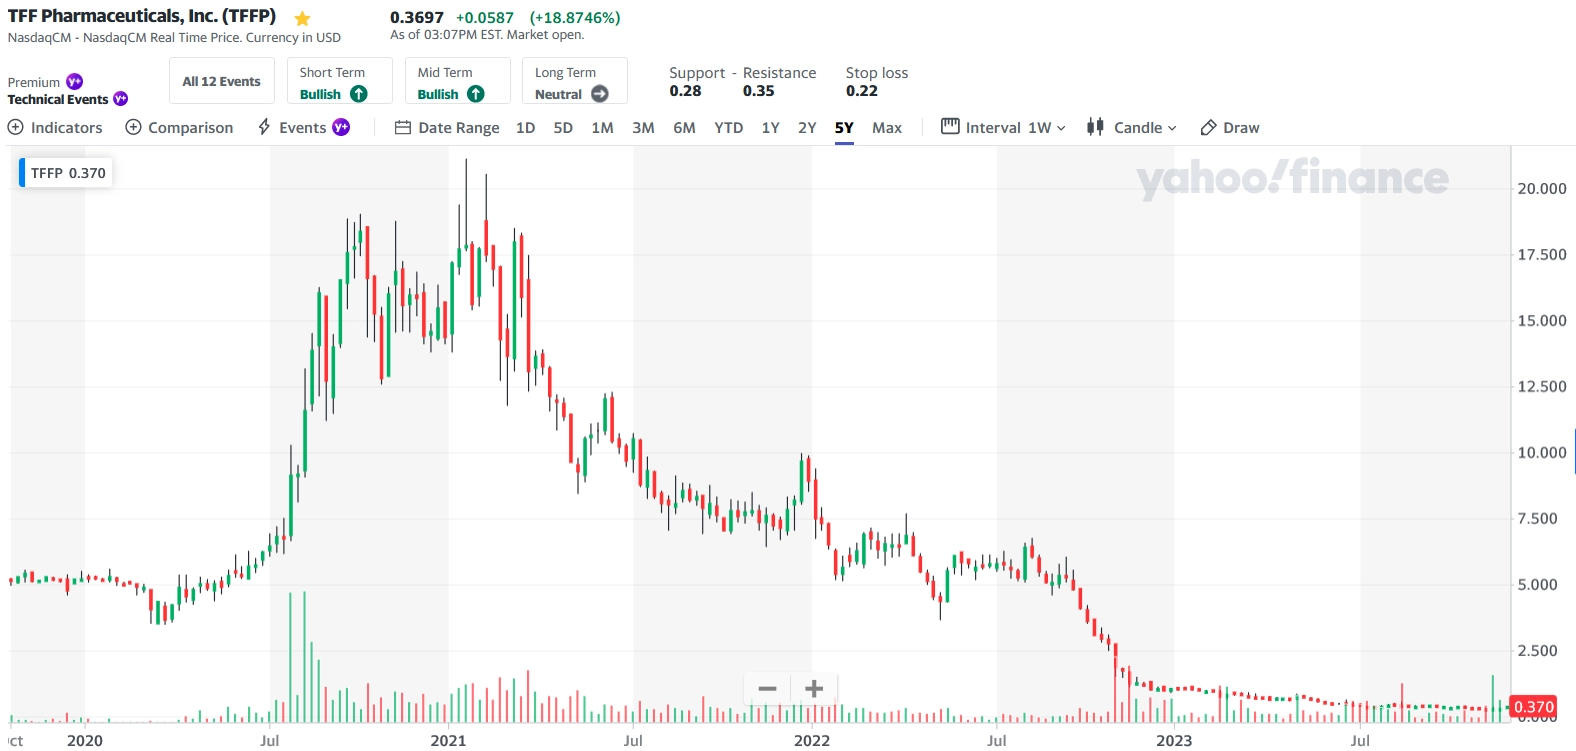
TFF Pharmaceuticals, Inc. (TFFP) is a microcap with a $21 million market capitalization. The drug delivery company takes pharmaceutical compounds and “freeze dries” those molecules and delivers them through inhalers used for many asthma drugs. This delivery process could be used with for a wide range of pharmaceutical drugs that already have FDA approval. This new drug delivery platform could lead to a bonanza of royalty streams for TFFP.
The chart below shows the substantial decline in the stock from $20/share to nearly $0.2/share before its most recent earnings report November 14th. https://finance.yahoo.com/news/tff-pharmaceuticals-inc-nasdaq-tffp-133752511.html?fr=yhssrp_catchall We found their comments and their planned data releases at the end of December and again in the first quarter suggestive of strong pivotal clinical data.
On Thursday, a new board of Director, Dr. Michael Patane said the following “The Team at TFF has established an impressive track record, which includes advancing two clinical-stage assets utilizing their ground-breaking formulation technology, Thin Film Freezing. Optimizing drug formulations to achieve sufficient biodistribution for pharmacological activity is mission critical for the success of any drug development program. Based on earlier Phase 1 data and initial compassionate use cases, Thin Film Freezing has already demonstrated its value in the clinic, and I believe there remains significant untapped opportunity to apply this innovative technology across a broad range of drug development programs.”
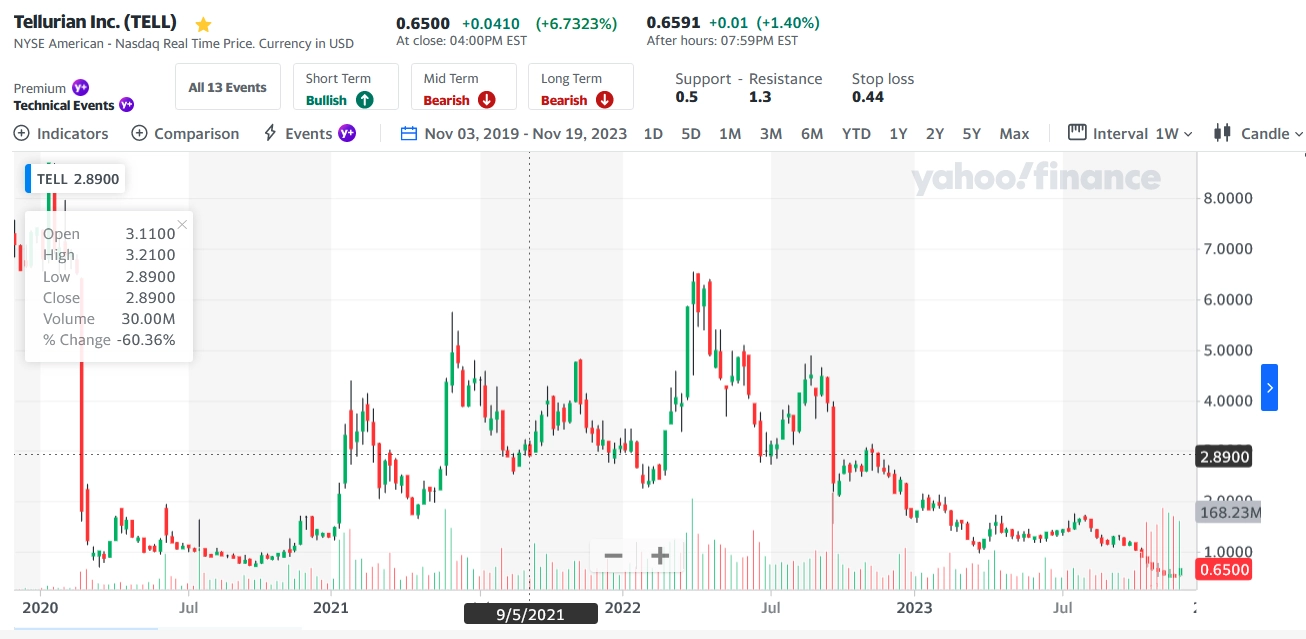
Tellurian Inc. (TELL) is a potentially disruptive LNG producer with a $412 million market capitalization. The company has the potential to earn $4-5 billion in cash flow per year in 2030, if TELL can successfully finance its Driftwood LNG project. The stock is down from $6/share in April 2022, when domestic and international natural gas prices spiked, following the Russian invasion in Ukraine. We believe the company is trading at a distressed value and may be turning up. The company hopes to announce plans to grow its upstream business, restructure is convertible debt, and finance its Driftwood LNG project in the coming weeks and months.
Conclusion:
Markets are confronted with numerous risks and cross currents regarding the economy, interest rates, inflation, and geopolitics. These unpredictable fundamental factors sit on top of bubble price valuations in stocks, bonds, and real estate. Furthermore, since 2009, nearly 15 years of abnormally low and declining interest rates have created overvaluations in stocks, bonds, and real estate. This macroeconomic transition argues for abandoning the 60/40 asset allocation strategy which has delivered strong risk adjusted returns for nearly 40 years. Alternatively, we favor a yield heavy, short duration, and value focused investment strategy that provides defensive characteristics, income for the years ahead, and flexibility to capture new emerging trends as they unfold. Specifically, we favor a 25% cash equivalent/25% commodity/ 25% stock/25% bond allocation to be safer and more attractive than the 60/40 stock bond allocation popularized over the last four decades of declining interest rates.
We believe that today’s popular investments and strategies do not adequately position portfolios for market risks and a rotation toward an inflationary cycle.